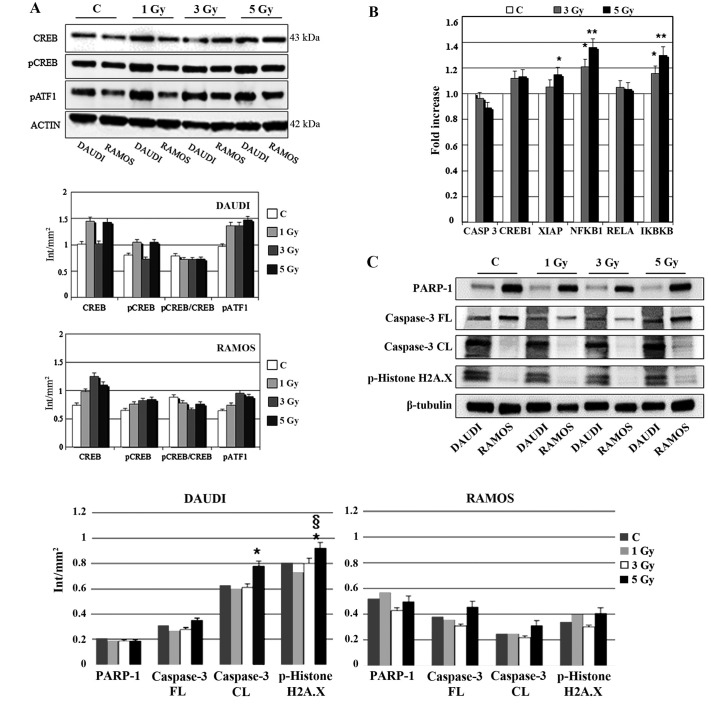
Figure 4.
Effects of different IR doses on nuclear transcription factors and cell cycle regulatory molecules. (A) Western blot analysis of CREB, pCREB and pATF1 in Daudi cells and Ramos cells at 30 min after exposure to different radiation doses, as indicated. Samples were normalised by incubating membranes in the presence of mouse β-actin monoclonal antibody. The most representative blot of six separate experiments is shown. (B) Relative gene expression of CASP3, CREB1, XIAP, NFKB1, RELA and IKBKB in Ramos cells, 30 min after IR exposure, as determined with real-time RT-PCR. Data was first normalised to GAPDH mRNA levels and then expressed as relative to control (calibrator sample, defined as 1). The graph bars represent the means ± SEM of relative quantification data derived from 3 independent experiments (*p<0.05, **p<0.01 vs. unirradiated control). y-axis, fold change. (C) Western blot analysis of PARP-1, caspase-3 (FL, full length; CL, cleaved forms), pHistone H2A.X in Daudi cells and Ramos cells at 30 min after exposure to different radiation doses, as indicated. Samples were normalised by incubating membranes in the presence of mouse β-tubulin monoclonal antibody. The most representative blot of three separate experiments is shown (*p<0.05 vs. unirradiated control).

