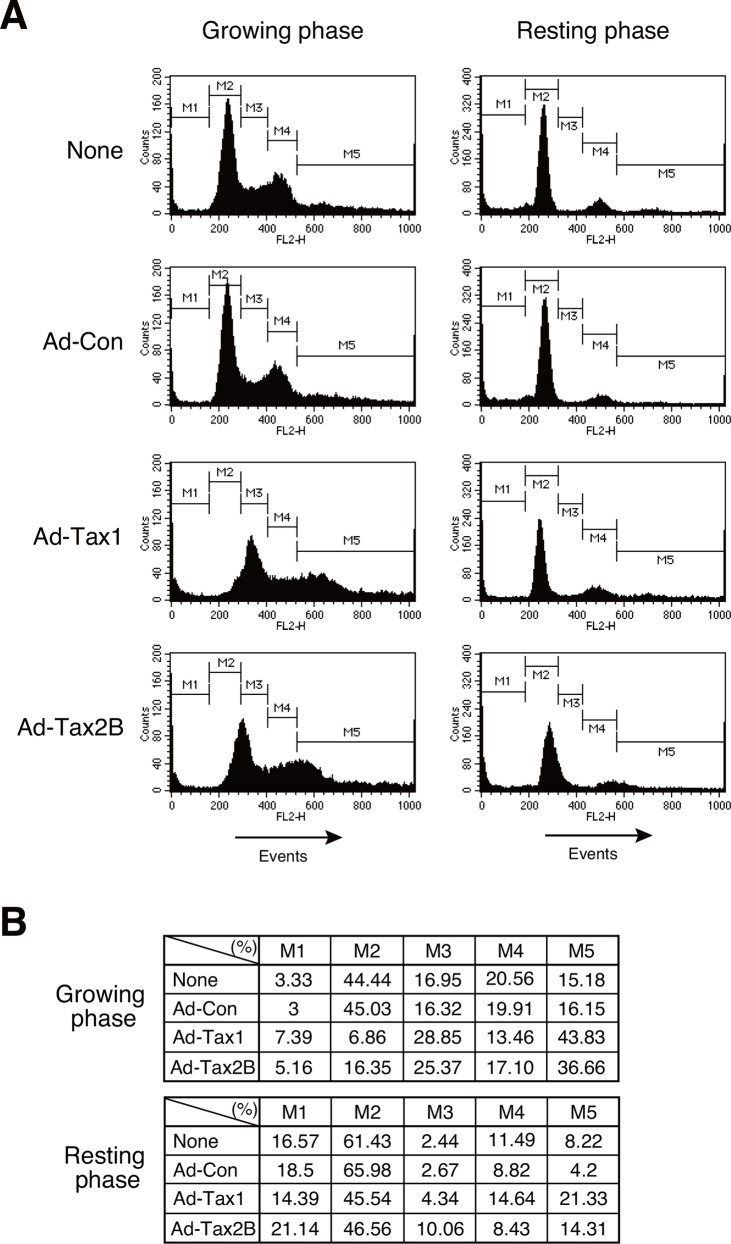
Fig 1. Cell cycle profiles of growing and resting cells with Tax1.
(A) Growing or resting Kit 225 cells were infected with recombinant adenoviruses expressing Tax1 (Ad-Tax1), Tax2B (Ad-Tax2B) or control virus (Ad-Con), and cultured for 72 h. DNA content was determined using a flow cytometer after PI staining. (B) Percentages of cell cycle phases were calculated from Fig 1A. M1, M2, M3, M4 and M5 indicate the sub-G0, G0/G1, S, G2/M and multinuclear cells, respectively.

