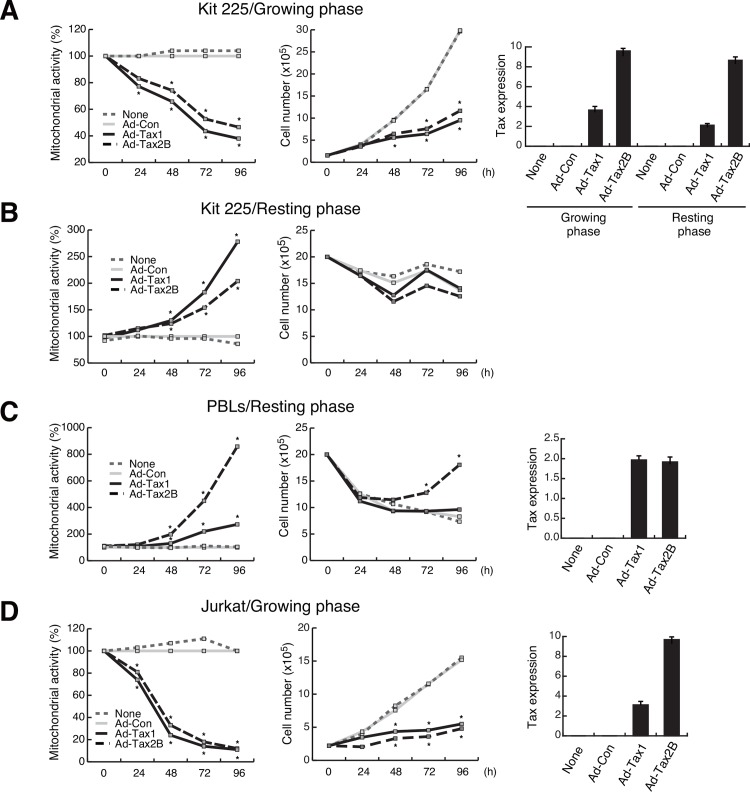
Fig 2. Differential effects of Tax1 on cell proliferation.
Growing (A) or resting (B) Kit 225 cells, PBLs (C) and Jurkat cells (D) were infected with Ad-Tax1, Ad-Tax2B or Ad-Con, and cultured for the indicated times. Mitochondrial activity was measured by the MTT assay and the cells were enumerated. Relative percentages of Ad-Tax1 or Ad-Tax2B samples to Ad-Con samples are shown. *, p < 0.05. Tax expression was monitored by qPCR. Values are shown as the means of the copy numbers ± SE after normalization against 18 S rRNA content.

