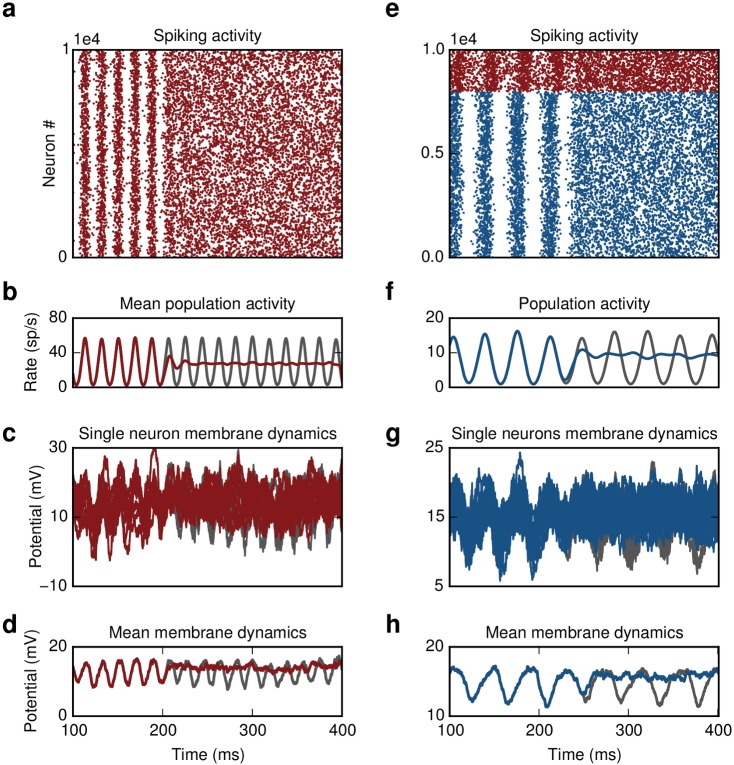
Fig 2. Closed-loop control of oscillations.
(a) Inhibitory network. Switching on the controller at t = 200 ms leads to suppression of oscillations.(b) Population activity without (gray) and with control (red). (c) Single membrane potential trajectories of ten randomly chosen neurons in the network (d) Averaged trace of subthreshold dynamics. (e) Excitatory-Inhibitory network. Switching on the controller at t = 250 ms leads to suppression of oscillations.(f) Activity of excitatory population without (gray) and with control (blue).(g and h) Same as (c and d), now membrane potential of excitatory neurons is shown. For better visualization the spike trains in (a) and (e) are thinned out.

