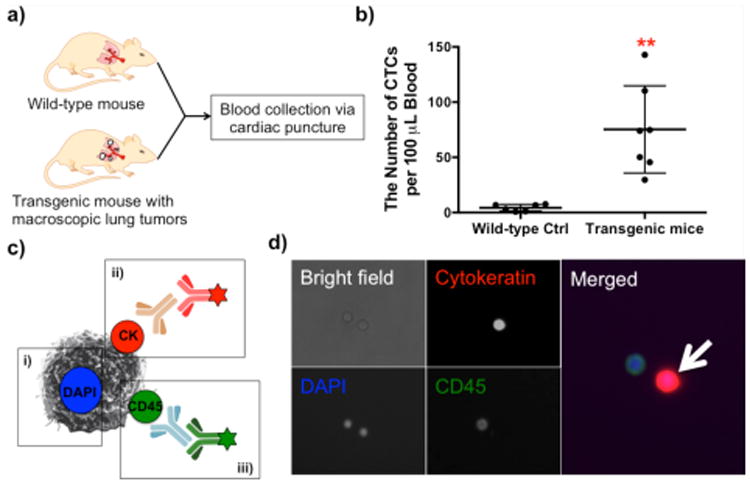
Figure 2.

CTC detection from healthy and transgenic mice using an anti-EGFR-G7 dendrimer-immobilized platform. a) An illustration of the experiment independently using wild-type FVB/N mice and CEO transgenic mice. b) Comparison of the captured cell numbers per 100 μL blood between two groups on the anti-EGFR-dendrimer surfaces. A significantly higher number of CTCs (75.3 ± 14.9 CTCs per 100 μL, n=7) was captured from the transgenic mice than that (4.4 ± 1.2 CTCs per 100 μL, n=6, p=0.0011) from wild-type controls. (Mean ± S.E., **p<0.005) c) An immunostaining scheme of the captured cells and d) its representative images: i) DAPI staining, ii) cytokeratin staining, and iii) CD45 staining. The cell with a white arrow was identified as a CTC.
