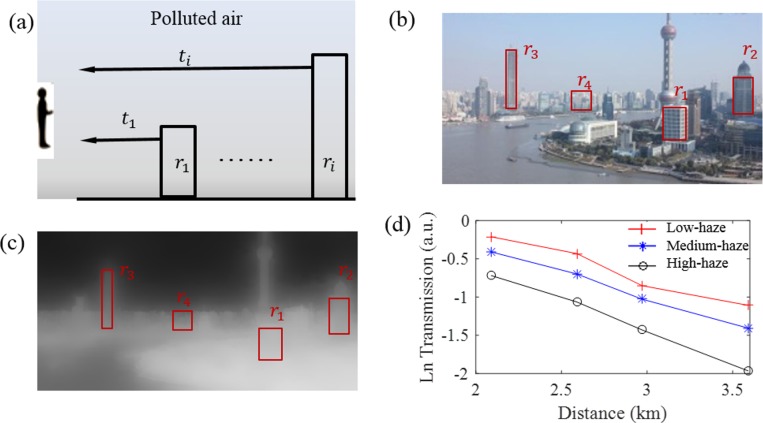
Fig 5. The transmission decreases as the distance or PM2.5 index increases.
(a) Schematic illustration of transmission variation with distance. (b) Four ROIs (r1~r4) located at increasing distances. (c) The estimated transmission map. (d) Semi-logarithmic plots of transmission curves vs. distance under different haze conditions.

