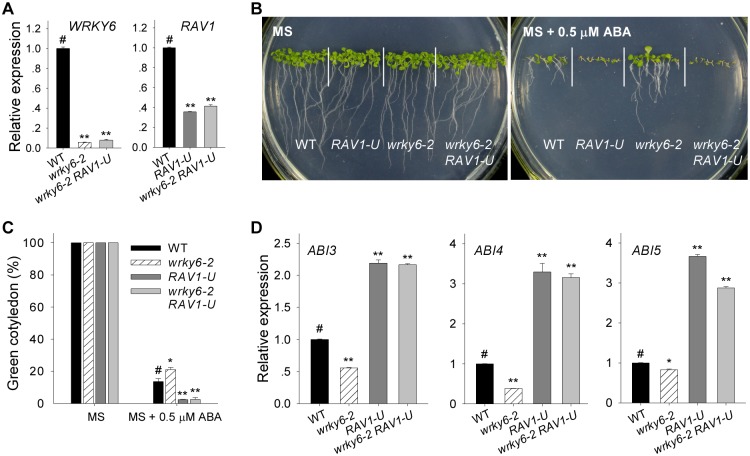
Fig 9. The ABA-insensitivity of the wrky6 mutant is abolished by suppression of RAV1.
A, The transcript levels of WRKY6 and RAV1 were tested by qRT-PCR. Data are shown as mean ± SE (n = 3). B, Phenotypic comparison. Imbibed seeds were transferred to MS medium (MS) or MS medium containing 0.5 μM ABA (MS + 0.5 μM ABA) for 10 d. C, Cotyledon-greening analysis. Imbibed seeds were transferred to MS or MS + 0.5 μM ABA medium for 7 d before determining cotyledon-greening percentage. Data are shown as mean ± SE (n = 3). More than 300 seeds were measured in each replicate. D, Expression of ABI3, ABI4, and ABI5 was tested by qRT-PCR in the wrky6-2 mutant, RAV1-U, wrky6-2 RAV1-U double mutant and wild-type plants. Each data represents the mean ± SE (n = 3). Asterisks indicate statistically significant differences compared with wild-type plants: *, P < 0.05; **, P < 0.01. Wild-type plants (WT) were used as a control (#).

