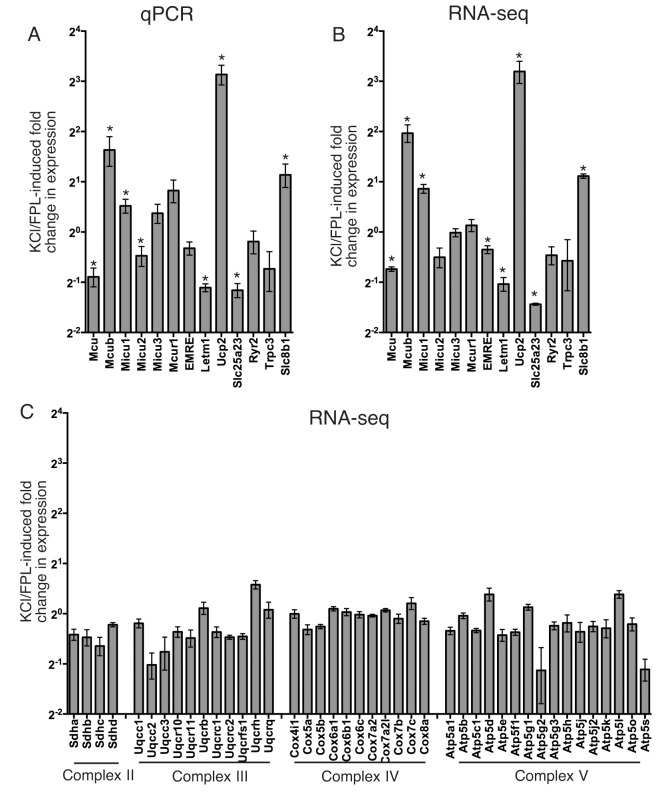
Fig 3. Ca2+ influx into cortical neurons modifies the expression of many MCRGs.
A) Neurons were treated ± KCl/FPL64176/MK-801 (see methods) for 24h, after which MCRG mRNA expression was analysed by qRT-PCR, normalised to Gapdh, and the % change relative to untreated control cells calculated. *p values (left to right) are 0.0003, 0.029, 0.016, 0.047, 0.0002, 0.007, 0.001, 0.042; alpha = 0.05, Student's one-sample t-test (n = 4 except Mcu, Micu1 (n = 8), Mcub. Micu2 (n = 5) and Micu3 (n = 6)). B) Neurons were treated as in (A) and RNA-seq analysis of transcriptome changes performed, with MCRG fold changes shown here. * Exact p values (left to right) are 0.002, 0.025,0.017, 0.038, 0.008, 0.028, 6.4E-05, 0.003; alpha = 0.05; Student's one-sample t-test (n = 3). C) KCl/FPL-induced changes in expression of a selection of nuclear encoded mitochondrial proteins (components of ETC complexes II-V), analysed by RNA-seq (n = 3).

