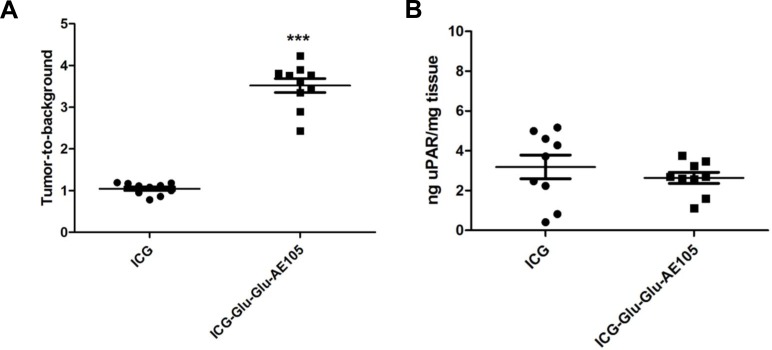
Fig 4. uPAR expression measured by optical signal and ELISA assay.
(A) The mean TBR value was significantly different (1.04±0.04 for ICG and 3.52±0.17 for ICG-Glu-Glu-AE105, p<0.0001), while the uPAR expression per mg tissue was almost identical and supports the hypothesis that the difference in ICG-Glu-Glu-AE105 and ICG signal is due to uPAR binding.

