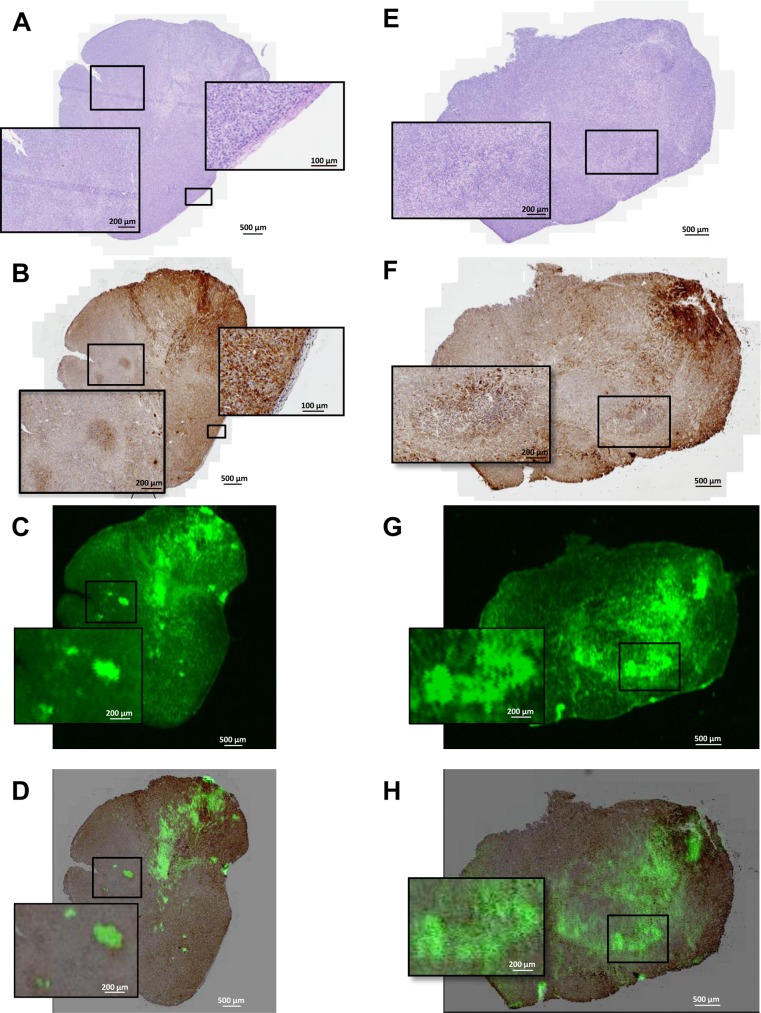
Fig 6. Ex Vivo histology and fluorescence images of s.c. U87MG tumor tissue sections.
Shown here is from the top H&E staining (A,E), uPAR staining by immunohistochemistry (B,F), uPAR staining by fluorescence from the injected ICG-Glu-Glu-AE105 (C,G) and merged uPAR IHC and fluorescence imaging (E,H). In the first row panel A shows the H&E staining of the tumor. uPAR IHC staining (B) illustrate two clear islands of uPAR positive cells which are also depicted with fluorescence imaging (C). Co-localization of uPAR expression and ICG-Glu-Glu-AE105 fluorescence is shown I the merged IHC and fluorescence image (D). Additionally in panel B the border between human xenograft tissue and mouse stroma is seen. In the second row another tumor speciment is shown wht H&E staining in panel E. The uPAR staining (F) show heterogeneous uPAR expression and the enlarged image show an island with cells expressing higher amount of uPAR. This is also depicted in panel G where the same island of cells can be located by fluorescence. The merged uPAR IHC and fluorescence image (H) show the co-localization of uPAR expression and fluorescent signal.

