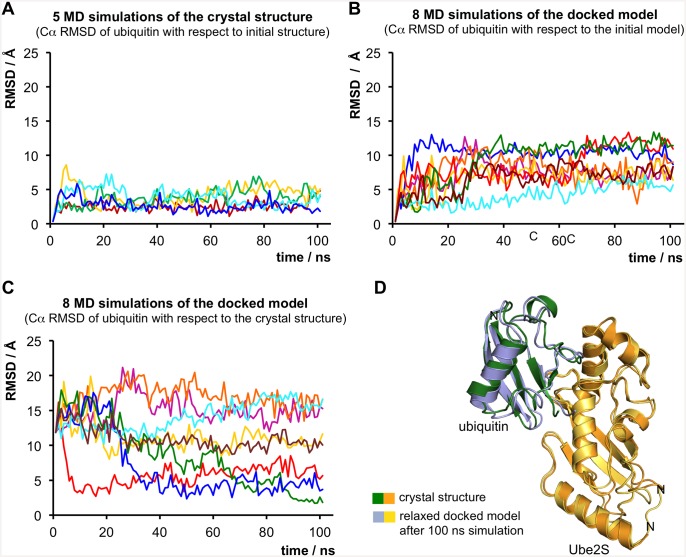
Fig 4. Molecular dynamics simulations.
(A) Five independent trajectories (colored differently) of the crystal structure over 100 ns each. For each simulation the Ube2S molecules were aligned and the Cα RMSD values for ubiquitin (in Å) with respect to the crystal structure are plotted over the time. (B) Eight independent trajectories (colored differently) of the docked model over 100 ns each. For each trajectory the Cα RMSD values for ubiquitin (in Å) with respect to the starting model after aligning the Ube2S molecules are plotted. (C) For each trajectory of the docked model (see (B)), the Cα RMSD values for ubiquitin (in Å) with respect to the crystal structure after aligning the Ube2S molecules are plotted. In three trajectories (colored in red, dark blue, and green) the model converges to a configuration that is very similar to the crystal structure. (D) Superposition of the docked model after 100 ns of simulation time (see (B) and (C), green simulation run) with the crystal structure.

