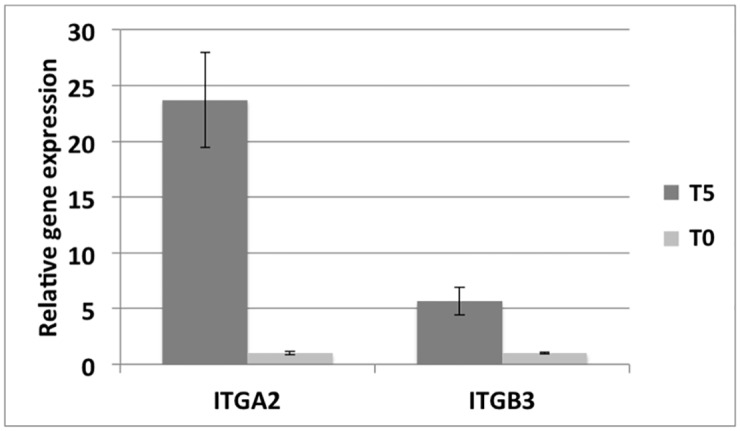
Fig 2. qPCR results plot.

Barplot showing the average values of the relative gene expression of ITBA2 and ITGB3 genes in 2 biological replicates of T0 (gray bars) and T5 (dark gray bars) samples. Standard deviation is reported above each bar.

Barplot showing the average values of the relative gene expression of ITBA2 and ITGB3 genes in 2 biological replicates of T0 (gray bars) and T5 (dark gray bars) samples. Standard deviation is reported above each bar.