Figure 4.
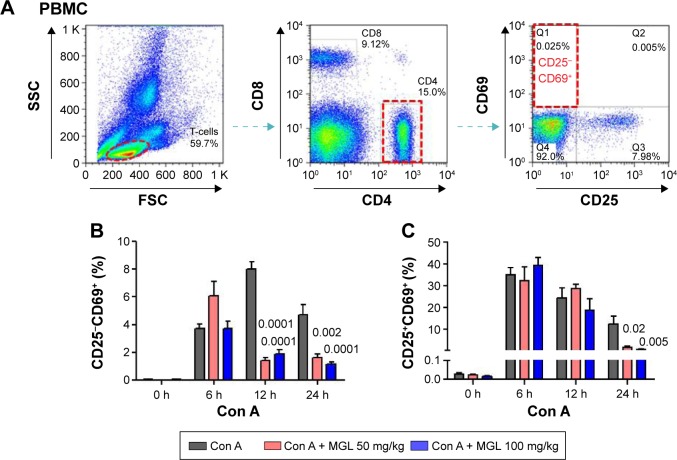
The subsets of CD4+ T-cells in PBMCs.
Notes: (A) Shows the frequency analysis of CD4+CD25−CD69+ T-cells, representing results from control mice. (B) The frequency of CD4+CD25−CD69+ T-cells in PBMCs, before and after Con A challenge for 6, 12, and 24 hours. (C) The frequency of CD4+CD25+CD69+ T-cells in PBMCs, before and after Con A challenge for 6, 12, and 24 hours. The data on the graphs indicate P values (treated group vs control group).
Abbreviations: Con A, concanavalin A; MGL, magnesium isoglycyrrhizinate; PBMC, peripheral blood mononuclear cell; SSC, side scatter; FSC, forward scatter.

