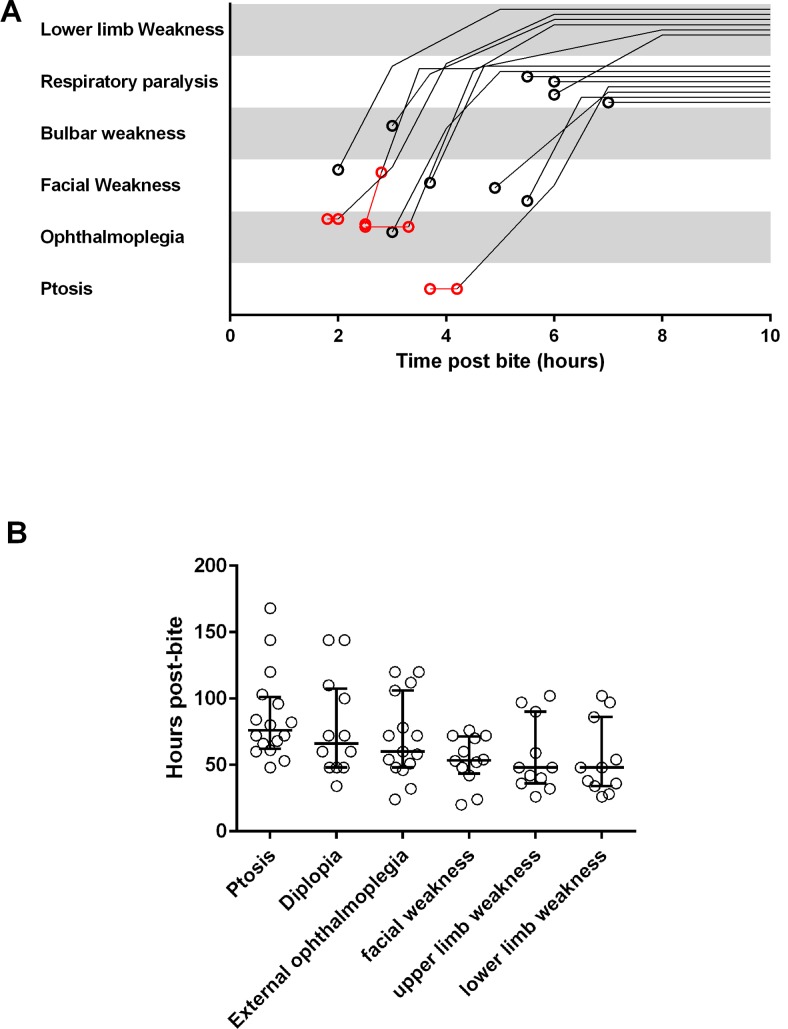
Fig 2. Time related change of neuromuscular paralysis.
A, Noodle plot showing the evolution of paralysis in 14 patients with severe neurotoxicity. Note the pre-antivenom events are in red; B, Scatter plots of the time taken for the complete resolution of five major clinical effects of neurotoxicity (muscle groups), including ptosis, diplopia, external ophthalmoplegia, facial weakness, upper limb weakness and lower limb weakness in the 17 patients with severe neuromuscular paralysis.

