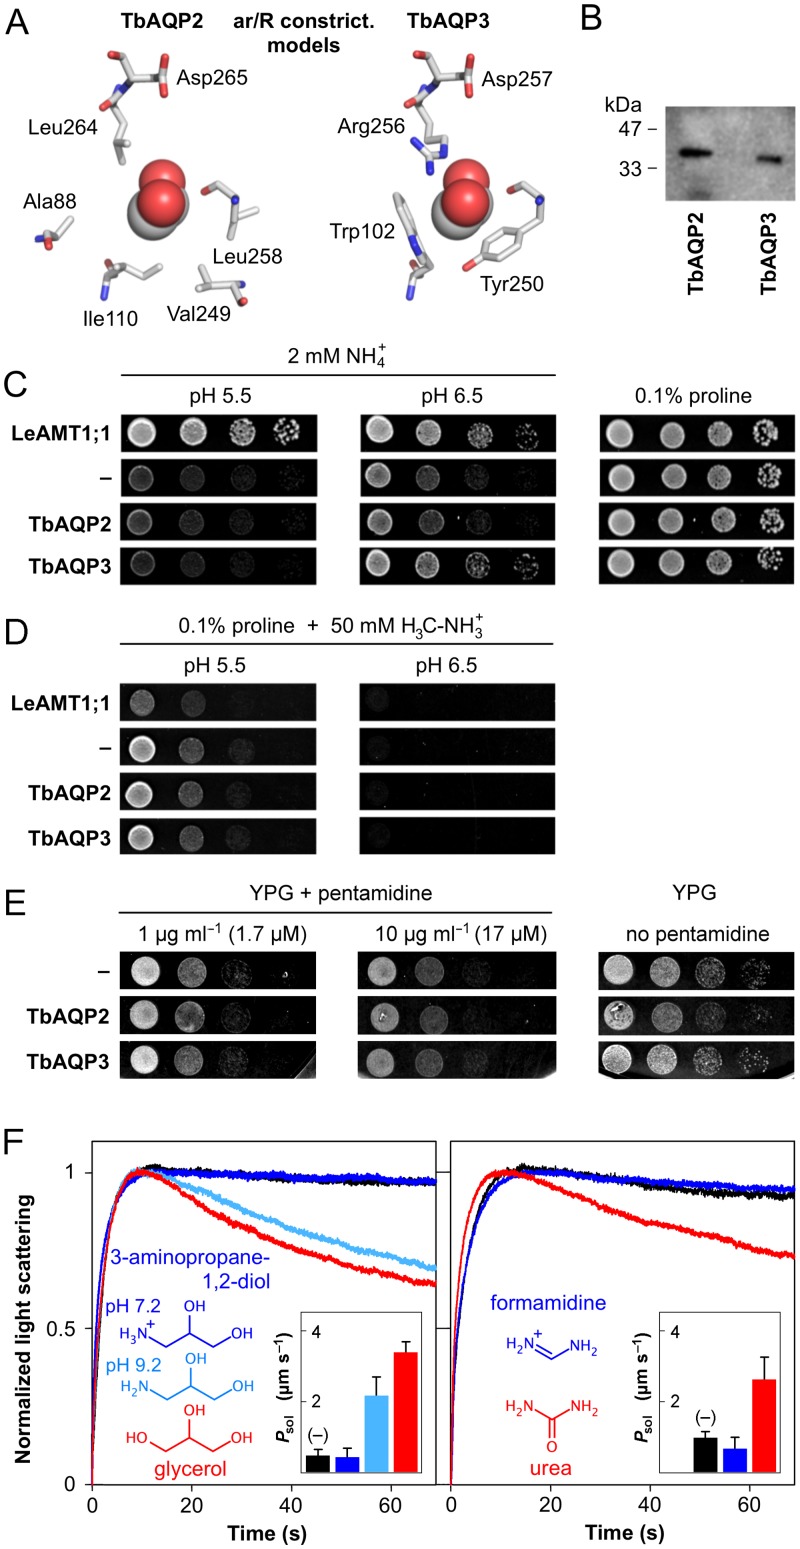
Fig 1. Cation exclusion by TbAQP2.
(A) Shown is the layout of the aromatic/arginine selectivity filter of TbAQP2 (left) and TbAQP3 (right) as seen from the top. A bound glycerol molecule is shown as spheres. The models are based on the E. coli GlpF structure (PDB# 1FX8). (B) Western blot using membrane protein fractions isolated from yeast expressing TbAQP2 and TbAQP3 that were N-terminally tagged with a hemagglutinin epitope. (C) Phenotypic growth assay of 31019bΔmep1-3 yeast lacking endogenous ammonium transporters on media with NH4 + as the sole nitrogen source. Growth at pH 6.5 indicates mainly background transmembrane diffusion of uncharged NH3; growth at pH 5.5 is due to transport of charged NH4 +. LeAMT1;1 is a tomato ammonium transporter, cells without transporter expression (–) served as negative controls. With proline as a nitrogen source growth is even for all cells. (D) Complementary phenotypic growth assay using yeast-toxic methylammonium instead of ammonium yielding opposite effects. (E) Expression of TbAQP2 does not increase the pentamidine-susceptibility of yeast grown on media with glycerol (YPG) as a non-fermentable carbon source. (F) Biophysical light scattering assays with TbAQP2-expressing yeast protoplasts in 300 mM hypertonic solute gradients. The rapid first phase of the traces indicates water efflux, followed by a slower solute influx phase. Red traces indicate permeability for physiological substrates glycerol (left) and urea (right). Traces of control cells without TbAQP2 are black. Structures and traces of 3-amino-propane-1,2-diol (left) and formamidine (right) are labeled dark blue (pH 7.2) or light blue (pH 9.2). The insets show deduced permeability coefficients (Psol) with S.E.M. from three independent experiments.

