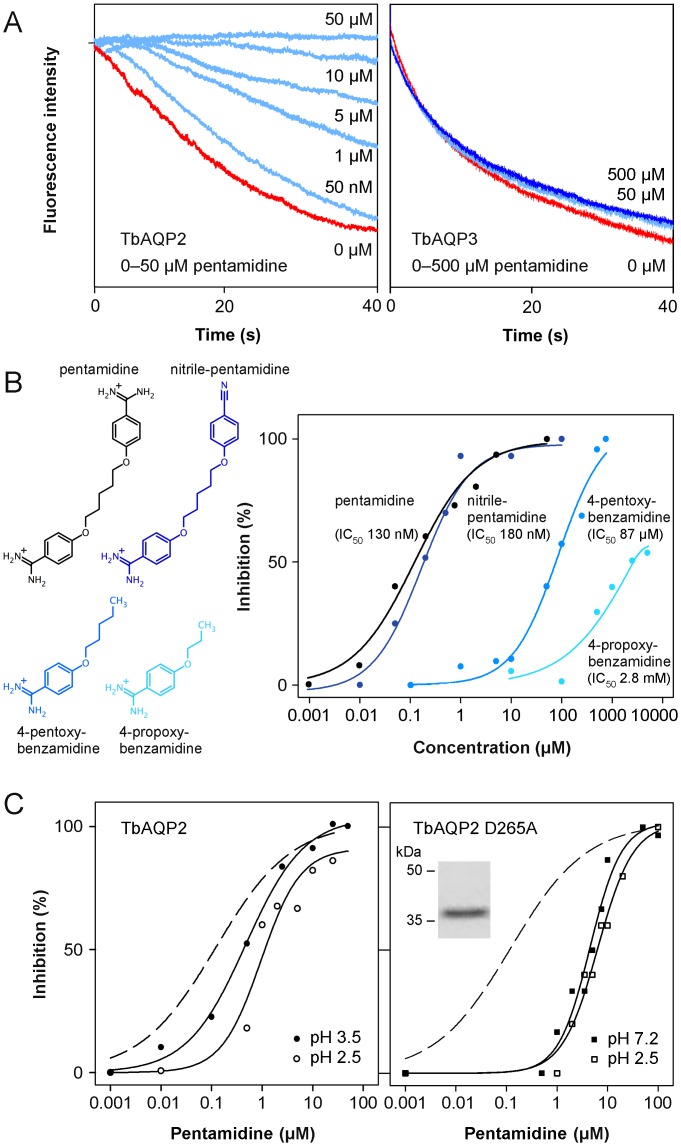
Fig 2. Inhibition of TbAQP2 glycerol permeability by pentamidine and derivatives.
(A) Shown are example traces of protoplast light scattering in 300 mM isotonic glycerol gradients in the presence of pentamidine. Red traces indicate uninhibited glycerol influx via TbAQP2 (left) and TbAQP3 (right), effects of pentamidine concentrations from 50 nM to 50 μM are colored light blue, and of 500 μM pentamidine in dark blue. (B) Structure-function evaluation of TbAQP2 inhibition by pentamidine. The chemical structures of the used compounds are shown on the left and respective dose-response curves on the right. (C) Effect of pH titration of TbAQP2 Asp265 and replacement by mutation to alanine on pentamidine inhibition. The dashed lines show the pentamidine inhibition of wild-type TbAQP2 at pH 7.2 (data taken from Fig 2B). The left panel shows dose-response curves of pentamidine pH 3.5 (closed symbols; IC50 450 nM), and pH 2.5 (open symbols; IC50 1.1 μM). The effect of the Asp265Ala point mutation (expression confirming Western blot in the inset) on the inhibition by pentamidine is depicted on the right. Data taken at pH 7.2 (IC50 4.5 μM) are indicated by closed symbols, those at pH 2.5 (IC50 5.8 μM) by open symbols. Each data point is an average of 5–9 light scattering traces each from at least two independent experiments.

