Figure 4.

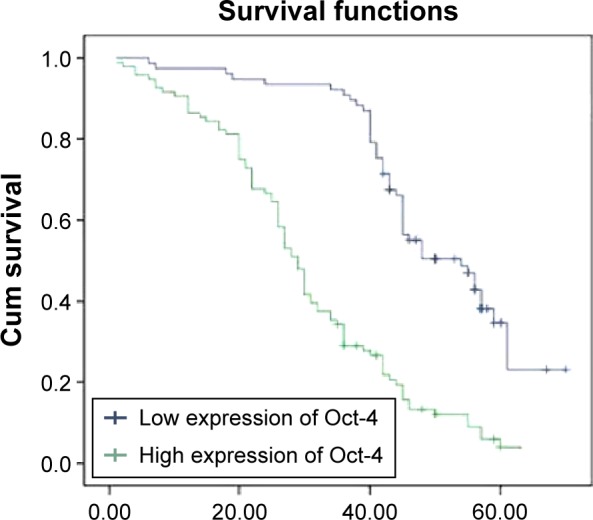
Kaplan–Meier curves with univariate analyses (log-rank) for patients with low Oct-4 expression versus those with high Oct-4 expression tumors in all gastric cancer in stage III.
Abbreviation: Cum, cumulative.

Kaplan–Meier curves with univariate analyses (log-rank) for patients with low Oct-4 expression versus those with high Oct-4 expression tumors in all gastric cancer in stage III.
Abbreviation: Cum, cumulative.