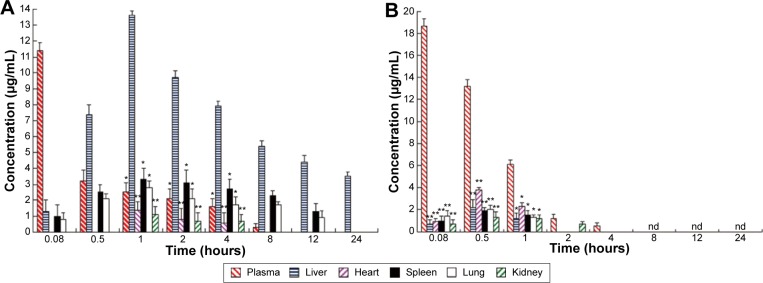
Figure 4.
RBG concentration–time column shape images of plasma and different organs.
Notes: (A) The RCPTN group; *P<0.05 and **P<0.01 versus corresponding liver. (B) The RS group; *P<0.05 and **P<0.01 versus corresponding plasma. All data represent the mean ± SD of experiments in decuplicate.
Abbreviations: RBG, Resibufogenin; RCPTN, RBG/coumarin-6-loaded poly(lactic-co-glycolic acid)-d-α-tocopheryl polyethylene glycol 1000 succinate nanoparticle; RS, RBG solution; SD, standard deviation; nd, not determined.

