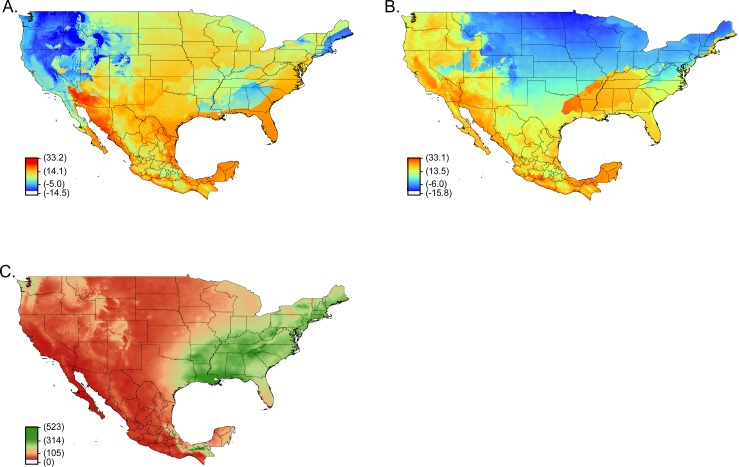
Fig 4. Environmental variables that may explain the gap between populations of O. turicata in Florida and Texas.
Shown are mean temperature of the wettest quarter (BIO8) (A), mean temperature of driest quarter (BIO9) (B), and precipitation of the driest quarter (BIO17) (C). The gradient of red to blue represents high to low temperatures (°C) (A–B). For the precipitation variable, a gradient of green to dark brown represents the amount of high to low precipitation (mm) (C).

