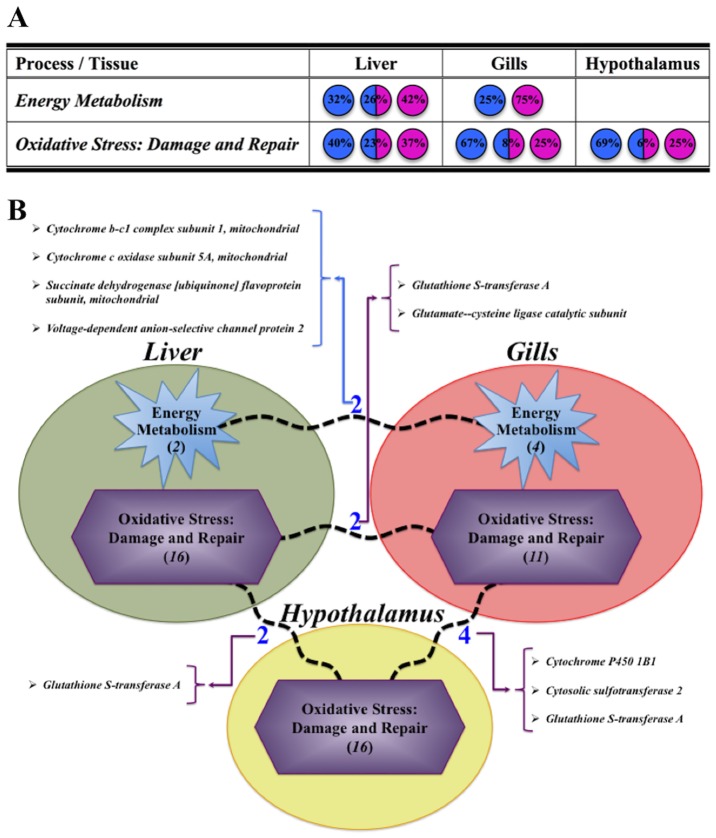
Fig 7.
(A) Evaluation of main processes detected in liver, gills and hypothalamus, with indication of the percentage (%) of genes differentially expressed and regulated by each salinity transfer (Hypo: blue, Hyper: pink or both: blue/pink). (B) Schematic representation of those clusters identified in each studied tissue, indicating and naming the number of common pathways (broken lines) and genes shared by them. Number of total pathways present in each cluster is displayed in brackets and italics.

