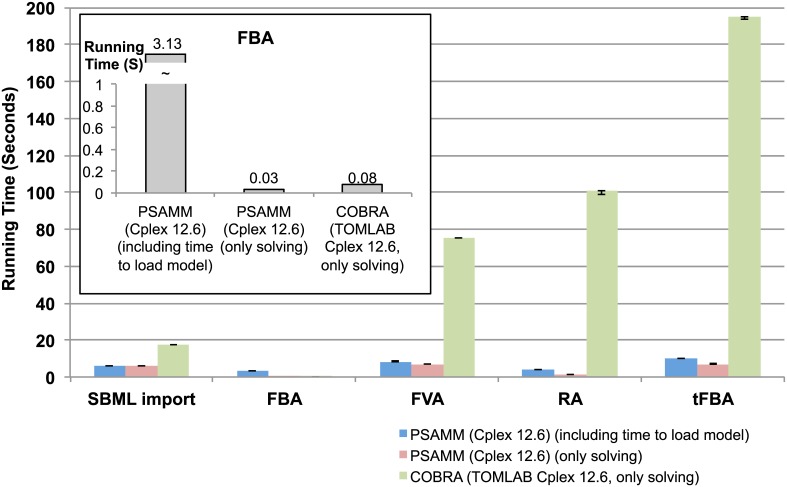
Fig 1. Comparing the running time of different functions in PSAMM and COBRA.
The running time for both the PSAMM overall function (blue) and the PSAMM problem-solving steps (red) were calculated, and the running time for COBRA only included the problem-solving step (green). Each value represents a median of seven simulation runs using the same specifications, and the error bars indicate the 25th and the 75th percentiles.

