-
A
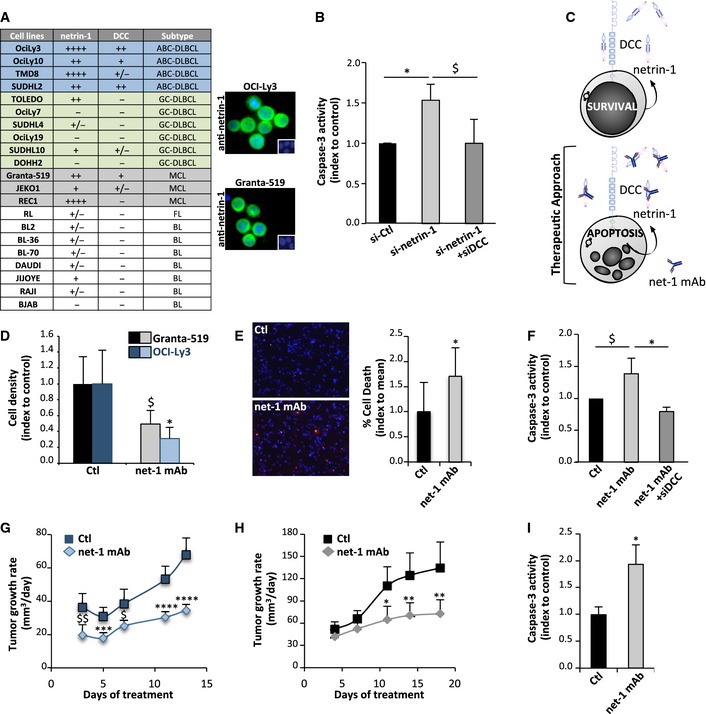
Expression of netrin‐1 and DCC in lymphoma cell lines. Quantification was performed by qRT‐PCR in 21 lymphoma cell lines. HPRT housekeeping gene was used as a standardization control. Netrin‐1 and DCC levels are indicated as follows: −, not detectable; + to ++++, moderate to very high expression. ABC and GC‐DLBCL cell lines are highlighted, respectively, in blue and green, MCL ones are in gray. Expression of netrin‐1 (in green) by immunofluorescence using netrin‐1 antibody on OCI‐Ly3 and Granta‐519 cell lines is shown on the right panel. Nuclei are counterstained in blue by Hoechst.
-
B
Caspase‐3 activity in Granta‐519 cells after transfection of scrambled siRNA (si‐Ctl) or netrin‐1 siRNA (si‐netrin‐1), with or without DCC siRNA (si‐DCC). Results are means ± SD of four independent experiments. $
P = 0.03; *P = 0.02; two‐sided Mann–Whitney U‐test.
-
C
Schematic model of impact of restoration of DCC‐induced cell death by using a netrin‐1 targeting antibody.
-
D
Effect of net‐1 mAb on Granta‐519 (left panel) and OCI‐Ly3 (right panel) cell density. Results are means ± SD indexed to control of four independent experiments. $
P = 0.05; *P = 0.03; two‐sided Mann–Whitney U‐test.
-
E
Effect of net‐1 mAb on induction of Granta‐519 cell apoptosis, detected by TUNEL staining. Left panel: representative images are shown. TUNEL‐positive cells are labeled in red. Nuclei are counterstained in blue by Hoechst staining. Right panel: quantification of one representative experiment out of three performed is exposed. Results are presented as percentage of TUNEL‐positive cells per field. *P = 0.04; two‐sided Mann–Whitney U‐test.
-
F
Caspase‐3 activity in Granta‐519 cells treated with net‐1 mAb antibody or with an unrelated Ig‐G1 antibody (Ctl), with or without silencing of DCC via siRNA (siDCC). Results are means ± SD of four independent experiments. $
P = 0.05; *P = 0.02; two‐sided Mann–Whitney U‐test.
-
G, H
Effect of netrin‐1‐interfering antibody net‐1 mAb on OCI‐Ly3 (G) and Granta‐519 (H) xenograft tumor growth. Results are presented as means ± 95% CIs of tumor growth rates from the beginning of treatment. *P = 0.02; **P = 0.01; $
P = 0.007; $$
P = 0.002; ***P = 0.0002; ****P < 0.0001; two‐sided Student's t‐test (Granta‐519) or Welch t‐test (OCI‐Ly3).
-
I
Caspase‐3 activity in tumors from control (n = 4) or netrin‐1‐interfering antibody (n = 4)‐ treated mice. Tumor resection was performed at the end of the treatment. Results are means ± SD of caspase‐3 activity. *P = 0.02; two‐sided Mann–Whitney U‐test.

