
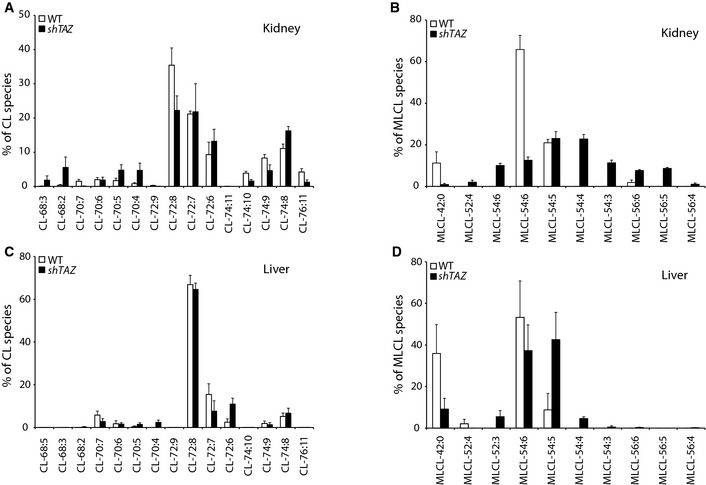
Figure EV1. Cardiolipin and monolysocardiolipin profiles in kidney and liver.
-
A–DLipid species profiles of cardiolipin (A, C) and monolysocardiolipin (B, D) in the mitochondria isolated from indicated tissues analyzed by mass spectrometry. Mean of n = 4 per genotype, ± SEM.