-
A–D
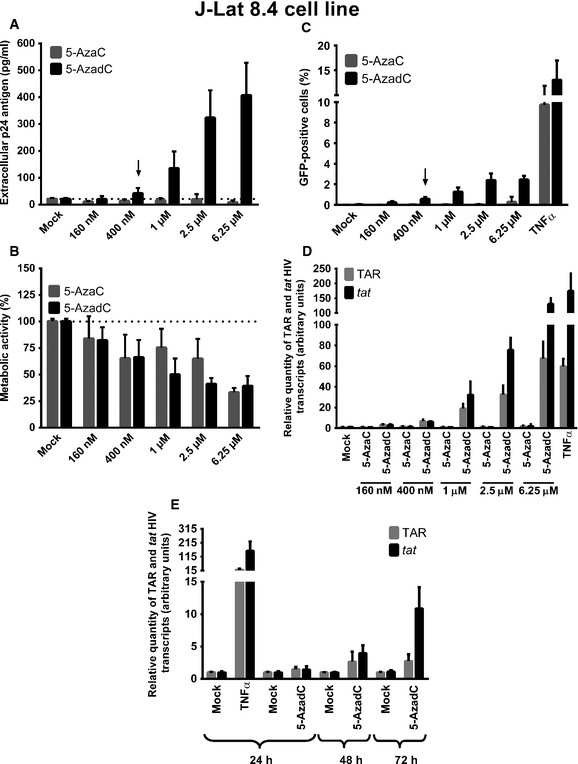
J‐Lat 8.4 cells were mock‐treated or treated with increasing concentrations of 5‐AzadC or 5‐AzaC. At 72 h post‐treatment, viral production was measured by quantifying p24 antigen production in culture supernatants (A); metabolic activity was assessed by a WST‐1 assay (B); viral protein expression was analyzed by FACS (C); and initiated (primers TAR) or elongated (primers tat) transcripts were quantified by RT–qPCR (D). The selected dose was indicated by an arrow.
-
E
J‐Lat 8.4 cells were mock‐treated or treated with 5‐AzadC (400 nM) or TNF‐α (10 ng/ml) as a positive control. At 24, 48 or 72 h post‐treatment, initiated (primers TAR) or elongated (primers tat) transcripts were quantified by RT–qPCR.
Data information: For (D, E), results were normalized using β‐actin gene primers and are presented as histograms indicating the fold inductions compared to mock‐treated condition for each time period. For (A–E), means and standard errors of the means from three independent biological duplicates (
n =
6) are indicated. The result obtained with mock‐treated cells was arbitrarily set at a value of 1 (D, E) and 100% (B).

