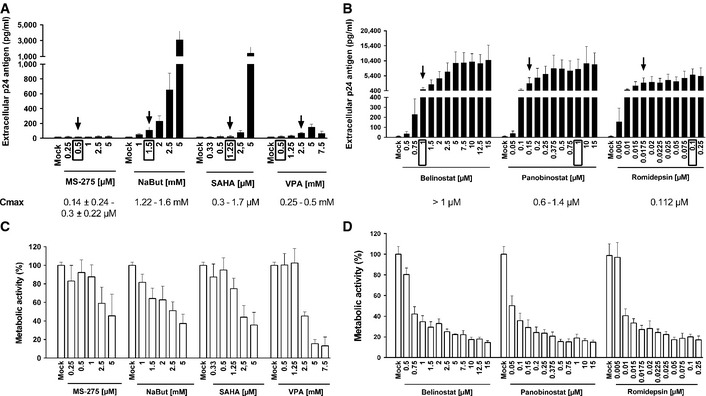
Figure 2. Determination of an optimal concentration for each HDACI to induce HIV‐1 production in latently infected cells.

-
A–DJ‐Lat 8.4 cells were mock‐treated or treated with increasing concentrations of HDACIs. At 24 h post‐treatment, viral production was measured by quantifying p24 antigen production in culture supernatants (A, B) and metabolic activity was assessed by a WST‐1 assay (C, D). Means and standard errors of the means from three independent biological duplicates (n = 6) are indicated. The result obtained with mock‐treated cells was arbitrarily set at a value of 100% (C, D). The selected doses are indicated by an arrow. Plasmatic concentrations after usual dosage (C max) of each drug in human therapy are indicated below the LRA names and by a box in the graph.
