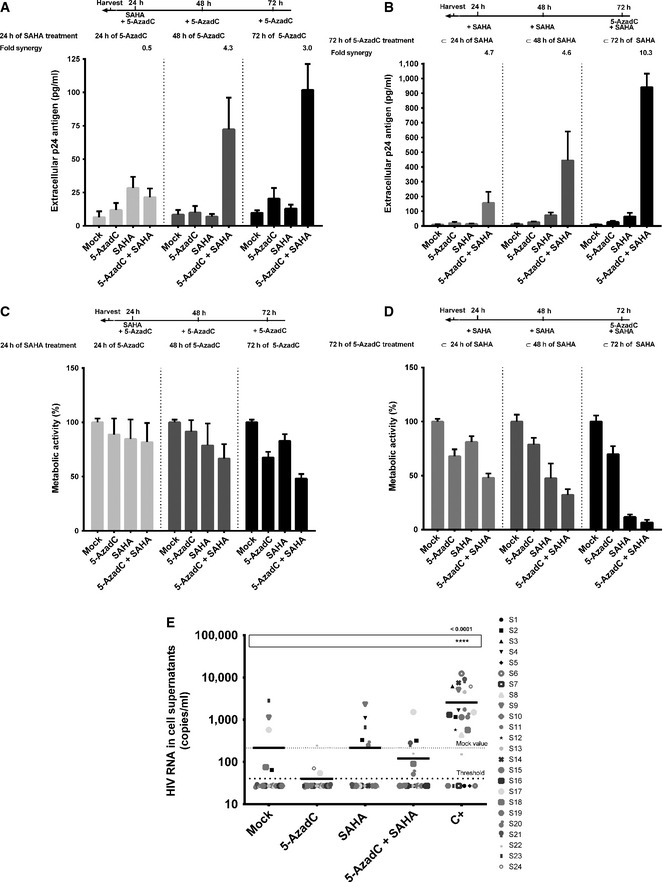
From data of
ex vivo cultures of CD8
+‐depleted PBMCs isolated from 24 HIV
+ patients presented in
Appendix Table S2, the extracellular HIV‐1 genomic RNA levels for each LRA treatment are represented. One night after cell purification, cells were mock‐treated or simultaneously treated with 5‐AzadC (1 μM) and/or SAHA (1 μM). Six days after treatment, the concentration of viral RNA in culture supernatants was determined (in copies/ml). The results were reported as the actual HIV RNA copy numbers/ml or as an estimated value calculated as 50% of the smallest value when HIV RNA was not detected in order to assign a log value. Means are represented. Nonparametric one‐way ANOVA for independent samples (Kruskal–Wallis) followed by paired comparisons between each treated condition and the mock‐treated condition (Mann–Whitney test) are performed.

