
Fig. 1.
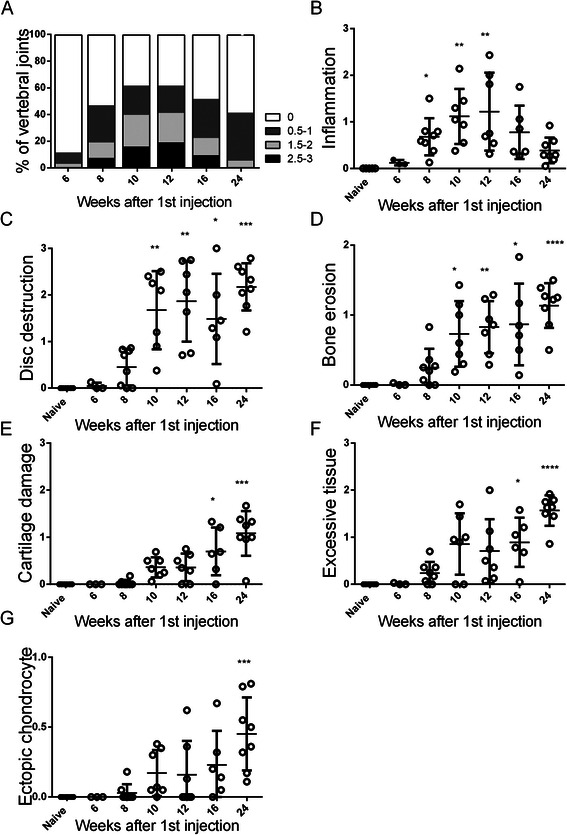
PGISp mouse model disease progression. a The severity of inflammatory infiltrate is represented by the percentages of different scores at each time point. Axial disease progression is described by the features of (b) inflammation, (c) disc destruction, (d) bone erosion, (e) cartilage damage, (f) excessive tissue formation and (g) ectopic chondrocyte formation. Each point represents the average scores of all vertebral joints within each affected mouse at the particular time points (3–10 mice per time point). The results are shown as mean ± standard deviation and analysed by Kruskal-Wallis test followed by Dunn’s multiple comparison test. ****P < 0.0001, ***P < 0.001, **P < 0.01, *P < 0.05 compared with naïve