
Fig. 2.
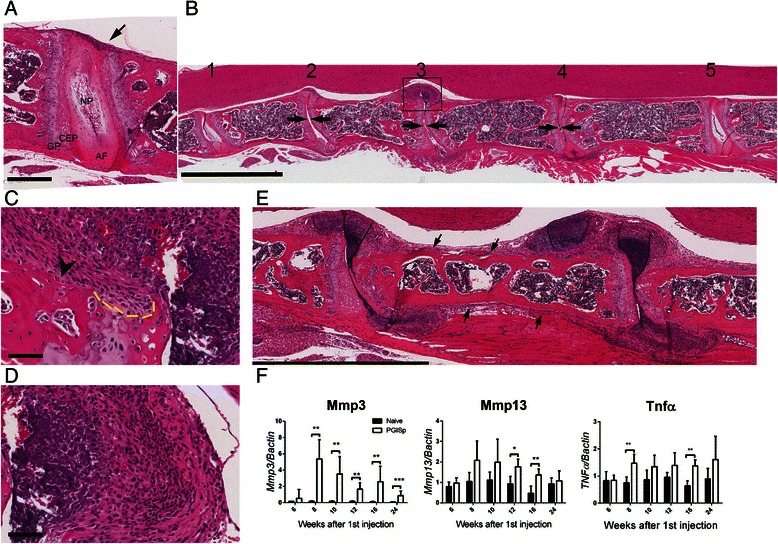
Progression of spinal inflammation in PGISp mice. a Representative H&E stain of mild inflammation in an 8-week time point mouse. Inflammatory cells accumulate at the periphery of the disc (arrow), but the rest of the intervertebral disc appears normal. AF annulus fibrosus, CEP cartilaginous end plate, GP cartilaginous growth plate, NP nucleus pulposus. Scale bar = 300 μm. b Variable disease penetrance in an 8-week PGISp mouse: (1) and (5) unaffected intervertebral discs, (2) disc destruction combined with early chondrocyte formation, (3) severe inflammation and disc destruction, and (4) moderate inflammation with incomplete disc destruction. Scale bar = 2 mm. c Magnification of the boxed area in (b) shows bone erosion (arrowhead) and cartilage damage. The yellow dashed line indicates the eroded cartilage surface. Scale bar = 60 μm. d Magnification of the boxed area in (b) demonstrating large numbers of mononuclear cells presenting in the affected joints. Scale bar = 60 μm. e Inflammation expansion along the longitudinal ligament (arrows). f mRNA expression of Mmp3, Mmp13 and Tnf in whole spine was analysed by qPCR and normalized to β-actin. Black bars represent naïve and open bars represent PGISp mice. Expression levels are presented as mean ± standard deviation. ***P < 0.0001, **P < 0.001, *P < 0.01 compared with naïve at the same time point, Mann-Whitney test. MMP matrix metalloproteinase, TNFα tumour necrosis factor-alpha