Fig. 6.

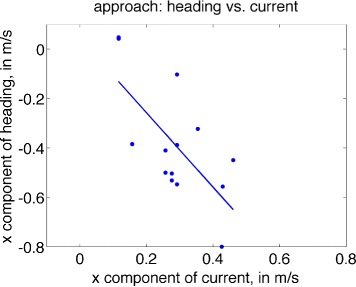
Scatterplot of average heading (lateral component) versus average lateral current, for each of 14 series featuring approach to the forage site, overlaid with the least-squares regression line

Scatterplot of average heading (lateral component) versus average lateral current, for each of 14 series featuring approach to the forage site, overlaid with the least-squares regression line