Figure 1.
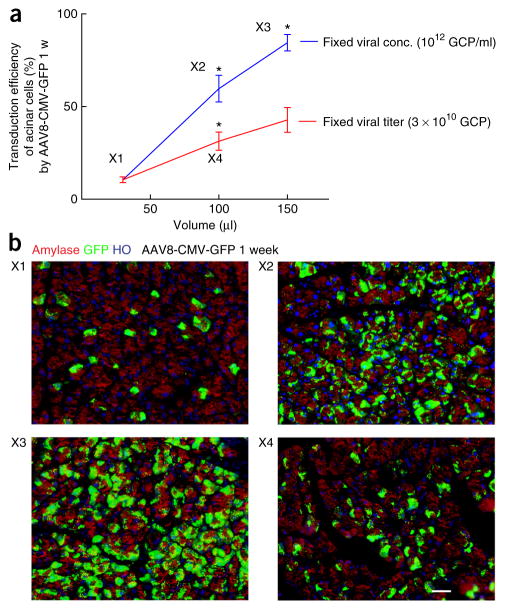
The transduction efficiency in acinar cells 1 week after AAV8-CMV-GFP infusion at different viral volumes. (a) The changes in the transduction efficiency of acinar cells with the changes in the infused viral volume when either fixed viral concentration (conc.) or fixed viral titer. X1–X4 represent different infusion conditions. Error bars are s.e.m. n = 5. *P < 0.05 compared with a shown smaller volume. (b) Representative pancreatic images of amylase by staining with an anti-amylase antibody (red; Sigma), GFP by direct fluorescence (green) and HO (Hoechst 33342; blue, nuclei staining) at X1–X4 1 week after AAV8-CMV-GFP infusion. Scale bar, 20 μm.

