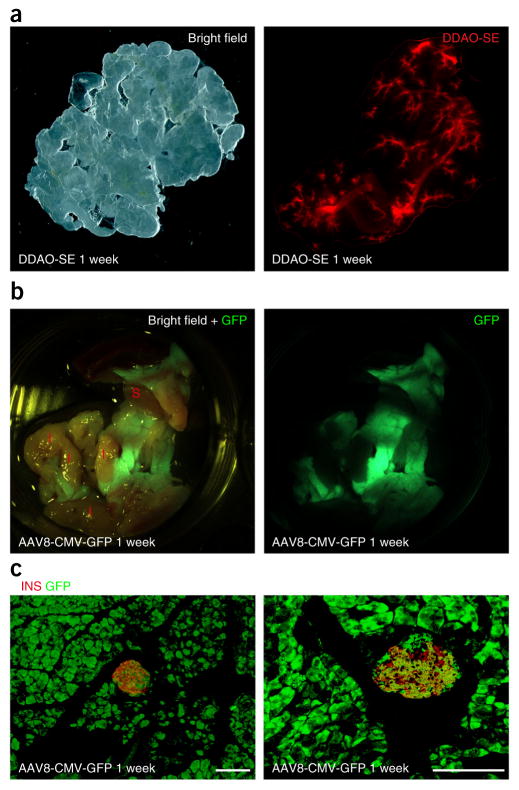
Figure 3.
Representative infusion images. Infusion conditions were determined according to Table 1. (a) Representative gross images of the pancreas 1 week after DDAO-SE infusion. (b,c) Representative gross (b) and immunohistochemical images (c) of the pancreas 1 week after AAV8-CMV-GFP infusion. GFP, direct green fluorescence (green); I, intestine; INS, insulin staining (red); S, spleen. Scale bars, 50 μm.

