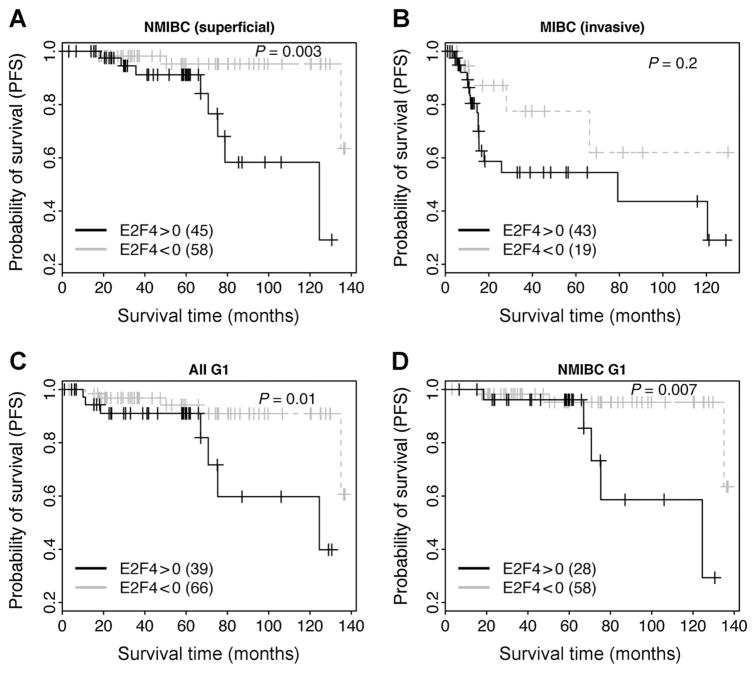
Figure 4.
Application of E2F4 program to prognosis prediction in NMIBC and MIBC samples. The survival curves of E2F4>0 and E2F4<0 groups are compared in NMIBC (A), MIBC (B), grade G1 (C), and grade G1 NMIBC (D) samples. Note that only patients untreated by systemic chemotherapy are included in this analysis.

