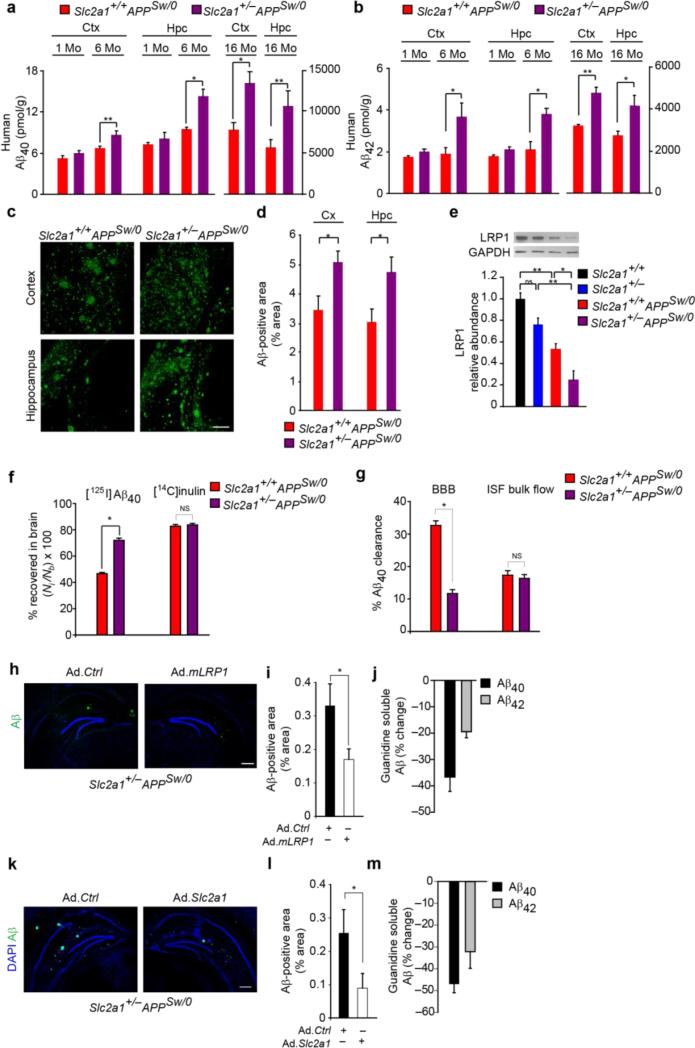
Figure 3. Aβ pathology in GLUT1-deficient APPSw/0 mice and reversal by LRP1 and GLUT1 re-expression.
(a-b) Cortical and hippocampal Aβ40 (a) and Aβ42 (b) levels in 1-, 6- and 16-month old Slc2a1+/+APPSw/0 and Slc2a1+/−APPSw/0 mice. Mean ± SEM, n=3-6 mice per group; *p<0.05 or **p<0.01. (c-d) Aβ-immunodetection (green) in the somatosensory cortex and CA1 hippocampal subfield (c) and Aβ load (d) in 16-month old Slc2a1+/+APPSw/0 and Slc2a1+/−APPSw/0 mice. Scale bar, 200 μm. Mean ± SEM, n=4-5 mice per group; *p<0.01. (e) Immunoblotting for the low-density lipoprotein receptor-related protein 1 (LRP1) in isolated microvessels (upper panel) and quantification (lower panel) in 16-month-old Slc2a1+/+, Slc2a1+/−, Slc2a1+/+APPSw/0 and Slc2a1+/−APPSw/0 mice. Mean ± SEM, n=4 mice per group; *p<0.05 or **p<0.01. (f) Clearance of [125I]-labeled human synthetic Aβ40 from CA1 hippocampal subfield in 16-month-old Slc2a1+/+APPSw/0 and Slc2a1+/−APPSw/0 mice. [14C]inulin was used to assess brain interstitial fluid (ISF) bulk flow. Time, 30 minutes post-injection. Mean ± SEM, n=3-5 mice per group; *p<0.05. (g) [125I]-Aβ40 clearance via BBB and ISF bulk flow (from the data shown in f). (h-i) Aβ-immunodetection (green) in CA1 hippocampal subfield (h) and quantification of Aβ-positive area (i) in 10-month-old Slc2a1+/−APPSw/0 mouse injected with empty adenovirus (Ad.Ctrl) and adenovirus carrying LRP1 minigene (Ad.mLRP1). Black, Ad.Ctrl hippocampus; White, Ad.mLRP1 hippocampus. Scale bar, 300 μm. Mean ± SEM, n=3 mice; **p<0.01. (j) CA1 hippocampal guanidine soluble Aβ40 (black) and Aβ42 (grey) levels in 10-month old Slc2a1+/−APPSw/0 mice injected with Ad.Ctrl and Ad.mLRP1. Graph - percent change of Ad.mLRP1 hippocampus to Ad.Ctrl hippocampus. Mean ± SEM, n=3 mice per group; *p<0.05. (k-m) Aβ-immunodetection (green) in CA1 hippocampal subfield (k) and quantification of Aβ-positive area (l) in 8-10-month-old Slc2a1+/−APPSw/0 mouse injected with empty adenovirus (Ad.Ctrl) and adenovirus carrying Slc2a1 gene (Ad.Slc2a1). Black, Ad.Ctrl hippocampus; White, Ad.Slc2a1 hippocampus. Scale bar, 300 μm. Mean ± SEM, n=3 mice; *p<0.05. (m) CA1 hippocampal guanidine soluble Aβ40 (black) and Aβ42 (grey) levels in 8-10-month-old Slc2a1+/−APPSw/0 mice injected with Ad.Ctrl and Ad.Slc2a1. Graph - percent change of Ad.Slc2a1 hippocampus to Ad.Ctrl hippocampus. Mean ± SEM, n=3 mice; *p<0.05. Full length blots are presented in Supplementary Figure 11.

