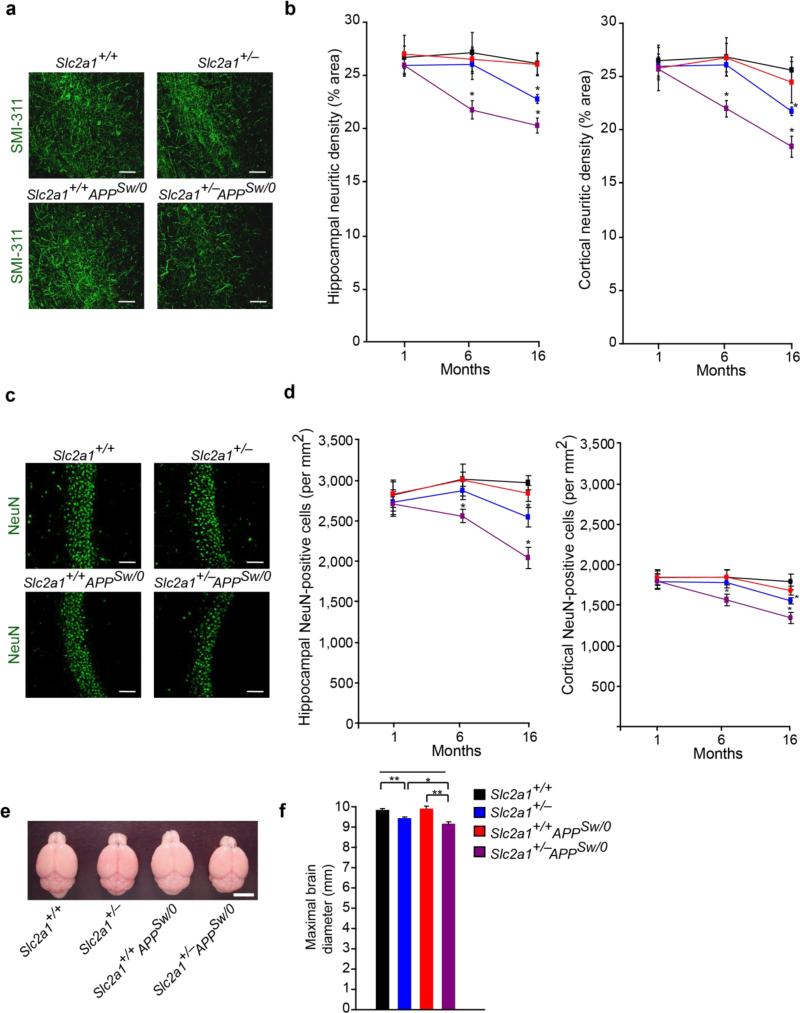
Figure 6. Accelerated neurodegenerative changes in GLUT1-deficient APPSw/0 mice.
(a) SMI-311 immunodetection showing neurites (green) in the CA1 hippocampal region of 16-month-old Slc2a1+/+, Slc2a1+/−, Slc2a1+/+APPSw/0 and Slc2a1+/−APPSw/0 mice. Scale bar, 50 μm. (b) Quantification of SMI-311-positive neuritic density in somatosensory cortex and CA1 hippocampal subfield in 1-, 6- and 16-month-old Slc2a1+/+, Slc2a1+/−, Slc2a1+/+APPSw/0 and Slc2a1+/−APPSw/0 mice. Scale bar, 50 μm. Mean ± SEM, n=3-4 mice per group; *p<0.05 or **p<0.01. (c) NeuN-positive neurons (green) in the CA1 hippocampal subfield of 16-month-old Slc2a1+/+, Slc2a1+/−, Slc2a1+/+APPSw/0 and Slc2a1+/−APPSw/0 mice. (d) Quantification of the number of NeuN-positive neurons in somatosensory cortex and CA1 hippocampal subfield in 1-, 6- and 16-month-old Slc2a1+/+, Slc2a1+/−, Slc2a1+/+APPSw/0 and Slc2a1+/−APPSw/0 mice. Mean ± SEM, n=3-6 mice per group; *p<0.05 or **p<0.01. (e-f) Representative low-magnification bright-field microscopy of mouse brains (e) and quantification of maximal brain diameter (f) in 6-month-old Slc2a1+/+, Slc2a1+/−, Slc2a1+/+APPSw/0 and Slc2a1+/−APPSw/0 mice. Scale bar, 5 mm. Mean ± SEM, n=5-6 mice per group; *p<0.05 or **p<0.01.

