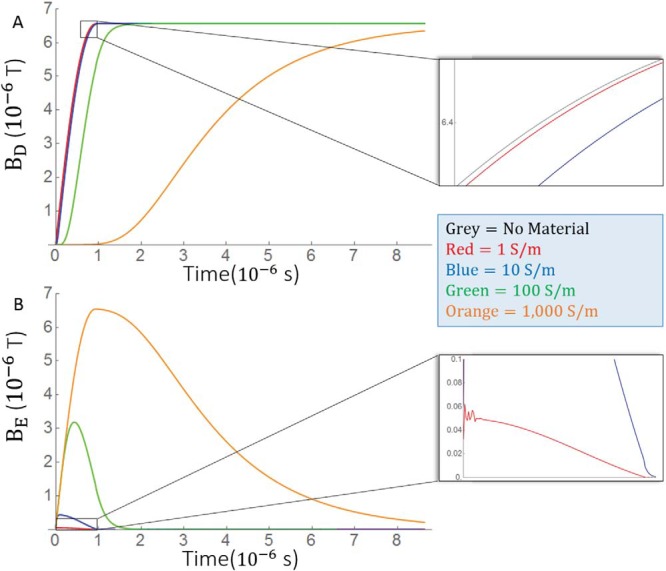
Figure 3.

Time courses of simulated magnetic fields under various conductivity values. Because differs only in sign between the pulse rise and decay of a symmetric pulse, only the pulse rise is simulated to reduce simulation time. (A) Time courses for the overall magnetic field. (B) Time courses for the secondary magnetic fields caused by eddy currents in the bulk eddy current simulation. The measurements were made at a point 4.5 cm above the isocenter on the bore axis. The eddy currents caused a delay in the growth of the overall magnetic field. Insets show a boxed region magnified. Different colors of the time course represent different conductivity values.
