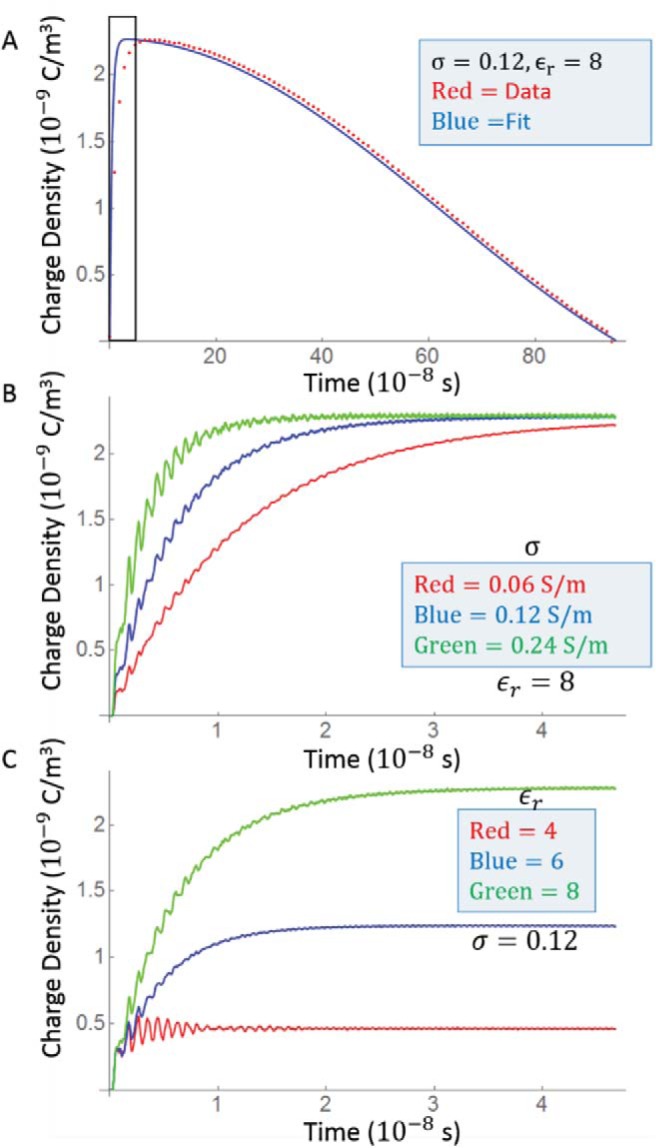
Figure 6.

Maximal charge density from the charge interface simulation. (A) The charge essentially follows the slew rate with a delay of about 10 nanoseconds. This delay is more clearly seen in (B) and (C), which show the first 50 nanosecond of (A) (boxed region) for different values of σ and ϵ. (B) The charge equilibrates more quickly in more conductive materials but to a constant value. (C) Larger permittivity values increase the induced charge density.
