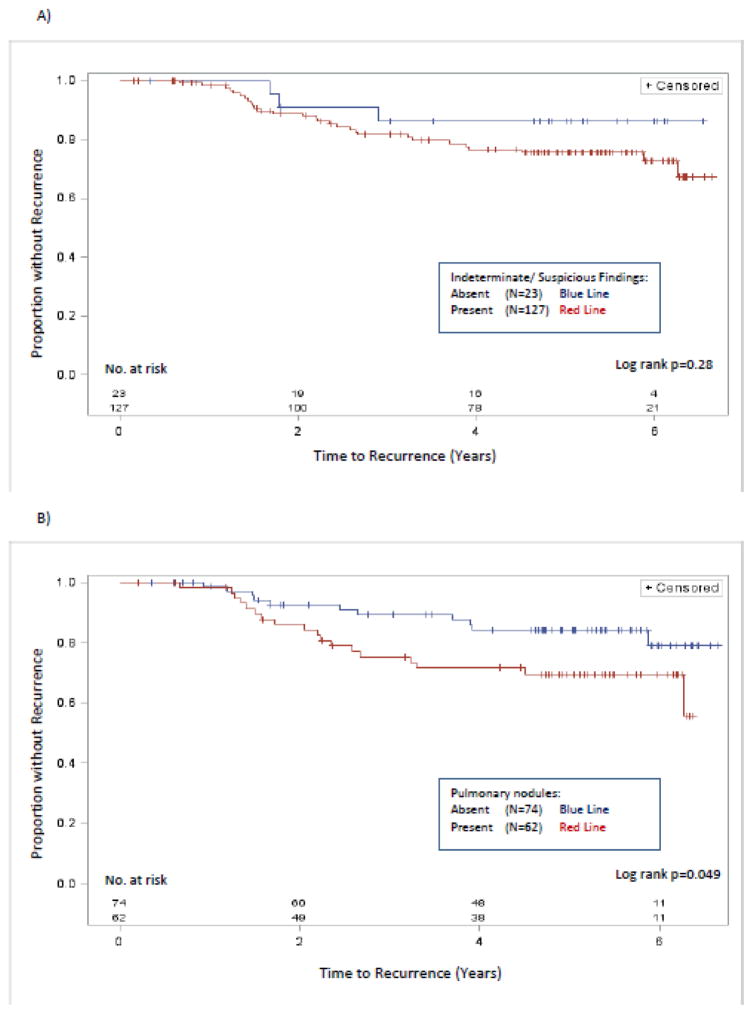
Figure 3.
Time to disease recurrence.
Kaplan Meier curves comparing time to disease recurrence between patients with and without (A) any indeterminate or suspicious finding (N=150) and (B) non-calcified pulmonary nodules on CT chest (N=136). Only patients without metastatic disease at diagnosis are included. Univariable log rank p-values are shown at the bottom right of each graph.

