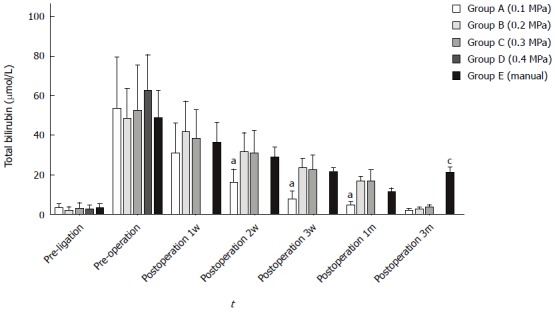
Figure 6.

Serum total bilirubin between each group at different time points. Group A exhibited a faster decrease 2 wk, 3 wk and 1 mo after surgery (ANOVA, aP < 0.05); group E exhibited a significant increase within 3 mo (ANOVA, cP < 0.05); data were not obtained from group D due to a high mortality rate.
