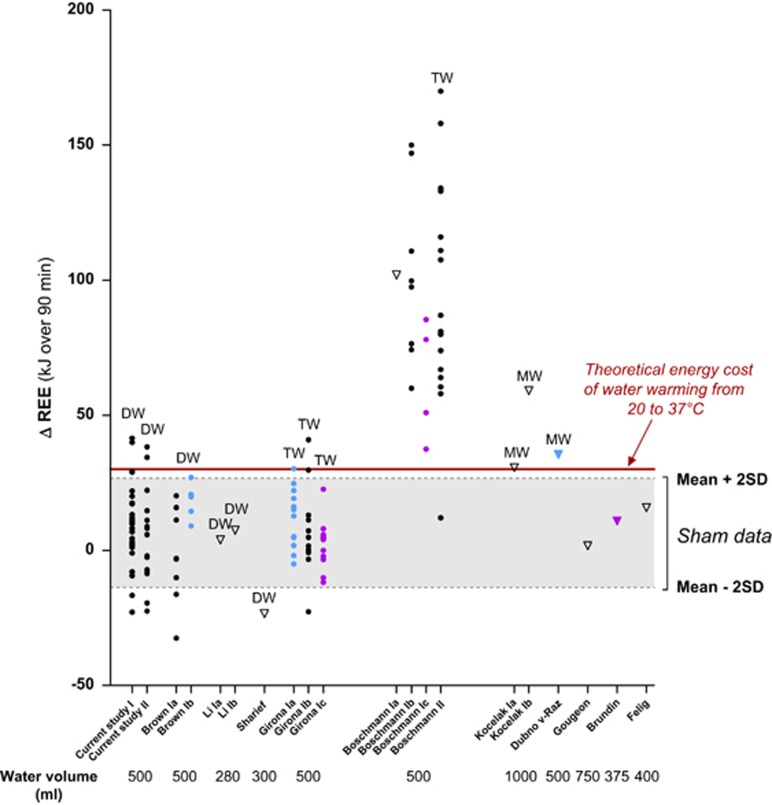
Figure 2.
Interstudy comparisons of ΔREE (kJ over 90 min) after drinking water. Data are for 20 experiments conducted in several laboratories (see Table 1 for references), including the current study (I for data presented in main text, and II for data presented in Supplementary Information, section B). Individual values are represented as filled circles; otherwise the mean values are indicated as triangles. Water types are abbreviated as follows: TW, tap water; DW, distilled water; MW, mineral water. Unlabeled studies are those for which water type was not specified. Water temperature are indicated as follows: black for room-tempered water (20–22 °C), pale blue for cold water (3–4 °C), and purple for body-tempered water (36.5–37 °C). The grey zone represents the range of values within mean±2 s.d. of ΔREE after Sham drinking in young adults in our experiment. Note: (i) for the study of ‘Li' conducted in women, 1a and Ib values correspond to data obtained in the follicular and luteal phases of the menstrual cycle, respectively; (ii) for the studies of ‘Boschmann', Ia, Ib and Ic are for data reported in Boschman et al.,6 whereas II is for data reported in Boschman et al.7; (iii) for the study of ‘Kocelak', Ia and Ib are for data in normal weight and obese subjects, respectively; (iv) for the study of ‘Dubnov-Raz', the mean value has been calculated from data presented in a figure. The average pre-drink REE (kJ min−1) was calculated as the average of three data points for REE during 6 min before water drinking, and the average post-drink REE (kJ min−1) between 15 and 60 min. The increase in REE is then calculated as the difference between the average post-drink REE and average pre-drink REE, and then multiplied by 90 to estimate the increase in REE (kJ) over 90 min post drink.

