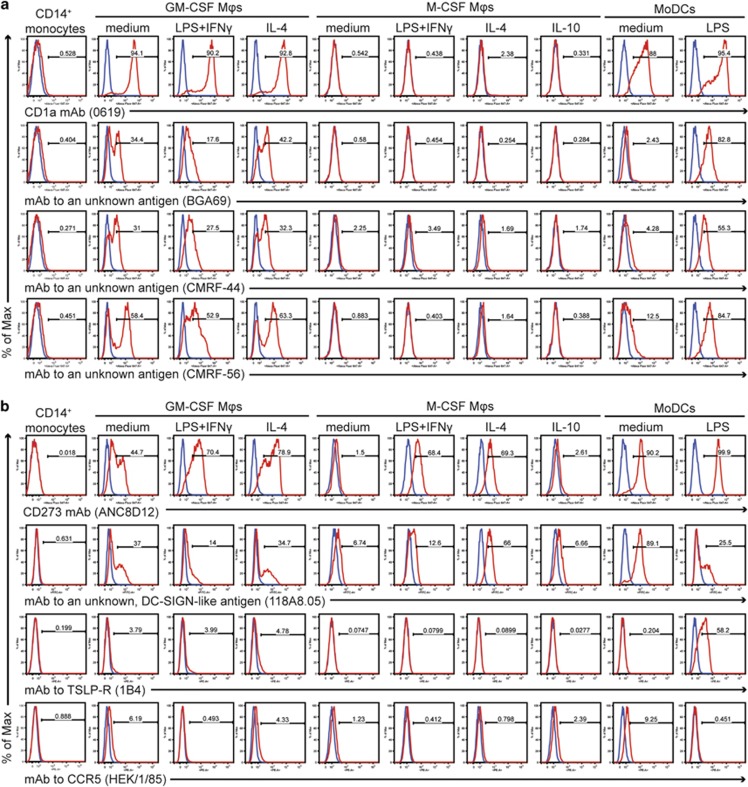
Figure 2.
(a) Expression profiles of HLDA10 mAbs that stained GM-CSF-differentiated macrophages and MoDCs. The expression profile of CD1a mAb 0619 (code 10-10) is shown at the top. Identical patterns were seen with another CD1a mAb (clone 010e, code 10-03), CD1b mAb O249 (code 10–18) and CD1c mAb L161 (code 10–26). Three mAbs with unknown specificity (code 10–38, clone BGA69; code 10–82, clone CMRF-44 and code 10–69, clone CMRF-56) showed a similar pattern but in contrast to the CD1 mAbs recognised poorly immature MoDCs. The expression profiles of these mAbs are shown at the bottom. (b) HLDA10 mAbs reactive with certain monocyte-derived macrophage and DC populations but not with freshly isolated monocytes. In all cases, the specific staining shown by the red histograms is overlaid with the background staining of the isotype control mAbs (shown in blue).

