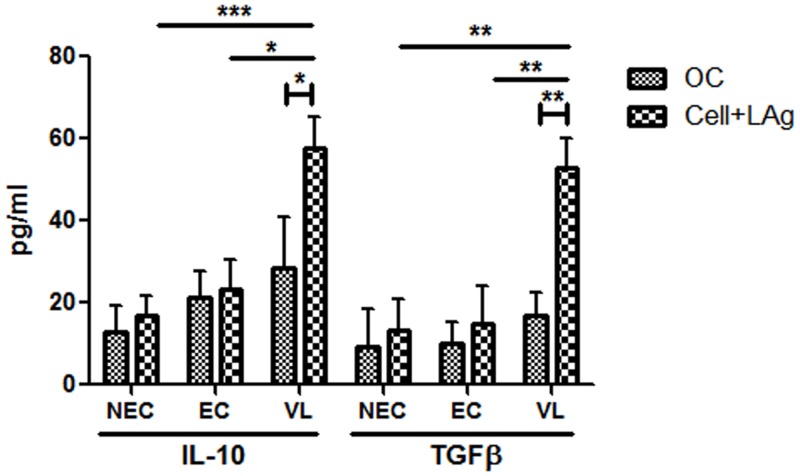
Fig 3. Leishmania-specific cell-mediated immune response in VL patients and healthy controls (ECs and NECs).
PBMCs were isolated from VL patients (n = 10), ECs (n = 5) and NECs (n = 10). Cells (2×10⁵/well) were stimulated with 12.5 μg/ml of LAg for 4 days and cytokines from supernatants were measured by ELISA. IL-10 and TGFβ levels (pg/ml) were compared between LAg-stimulated and unstimulated samples (only cell, OC) from VL patients as well as LAg-stimulated samples from ECs and NECs. Data are represented as mean ± SE. P values were calculated using non-parametric Mann-Whitney U test and Unpaired t test; P<0.05 was considered significant.

