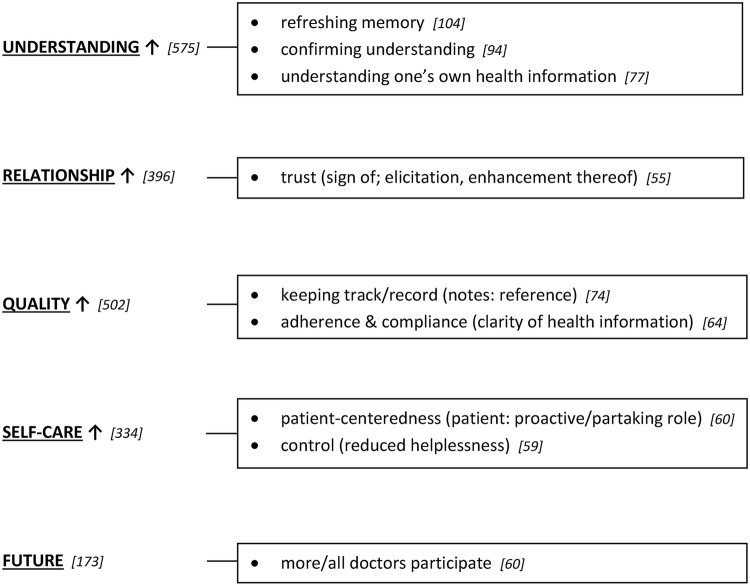
Figure 5.
Overview of frequency analysis. Most frequently checked codes from codebook—results from free-text answers/survey data (FTA), organised on per domain/theme basis. Left side= themes (domains); right side= codes. Numbers depicted in square brackets reflect the numbers of identified codes (with the numbers on the left side—following each theme—expressing sum scores=absolute numbers of identified codes per theme; the numbers on the right side—following each depicted code—expressing how often a specific code was identified). Note: Arrows behind each theme indicate the overall direction of reported effects (in this case: improvements/increase in all domains following/in view of OpenNotes practice).

