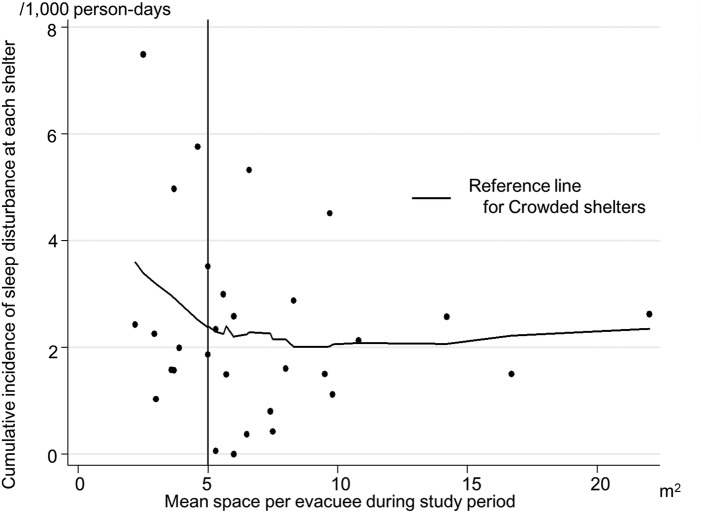
Figure 2.
Relationship between mean space per evacuee during the study period at each shelter and the cumulative incidence of sleep disturbance at the shelter. This scatter diagram indicates the association between mean space per evacuee at each shelter and cumulative incidence of sleep disturbance at the shelter with a smooth-fit curve using the locally weighted scatter-plot smoothing technique.

