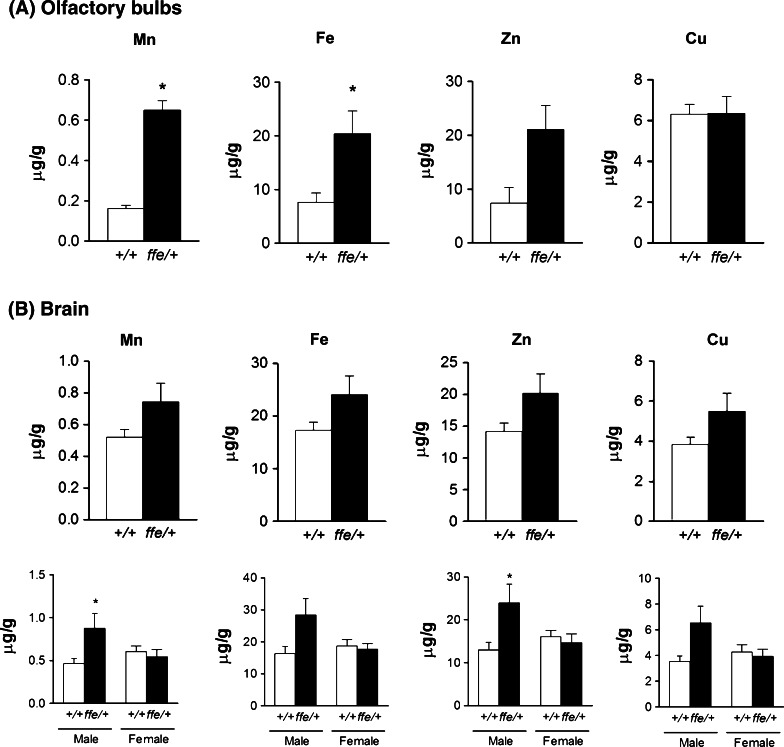
Fig. 3.
Metal levels in brain of wild-type and flatiron mice. Olfactory bulbs (a) from 3 to 4 mice of wild-type and flatiron mice were pooled and determined for metal levels by ICP-MS. The rest of the brain (b) was determined for metal levels by ICP-MS. Empty and closed bars represent +/+ and ffe/+ mice, respectively. Data are mean ± SEM (n = 10 mice/group in panel a; 6 male and 4 female per genotype in panel b). *P < 0.05 between +/+ versus ffe/+ mice; t-test

