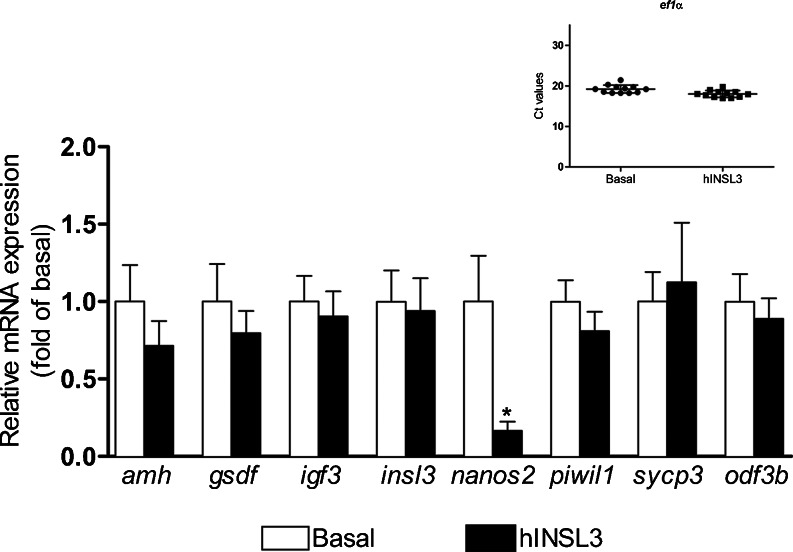
Fig. 6.
Relative mRNA levels of insl3 and selected Sertoli (amh, gsdf and igf3) and germ cell (nanos2, piwil1, sypc3 and odf3b) genes. Inset Transcript levels of ef1α in the absence (Basal) and presence (hINSL3) of hINSL3; Ct values for the reference gene ef1α. Results are presented as means ± SEM (n = 12)

