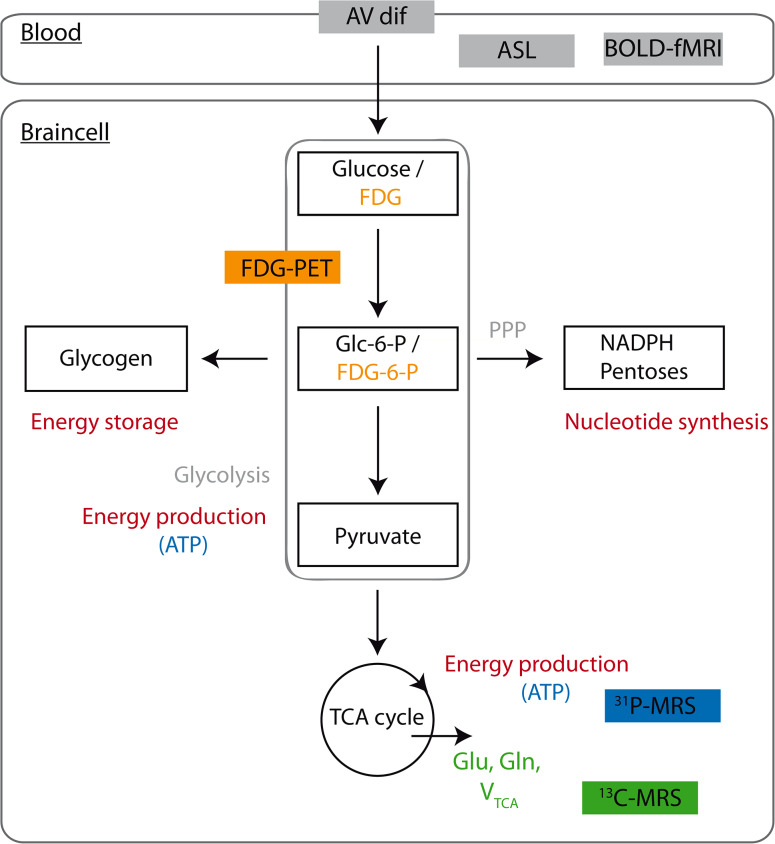
Fig. 1.
A simplified illustration of the multiple metabolic pathways of glucose in the brain and the metabolic signals used in different neuroimaging techniques. The initial step of glucose metabolism is phosphorylation of glucose to glucose-6-phosphate (Glc-6-P) by hexokinase. Glc-6-P can enter several metabolic pathways in the brain. It can be metabolized to produce energy via glycolysis or the TCA cycle. Glycolytic and TCA cycle intermediates are also used for the synthesis of amino acids and neurotransmitters. In addition, Glc-6-P is a precursor for glycogen. Lastly, metabolism of Glc-6-P via the pentose phosphate pathway (PPP) provides pentose for nucleotide synthesis and NADPH, required for reductive reactions, such as lipid synthesis and for protection against oxidative stress. Arteriovenous concentration differences (AV dif) can be used to estimate global cerebral metabolic rate from the disappearance of metabolites from the circulation. PET (depicted in orange) uses radiolabeled glucose analogues (such as FDG), which are trapped early in metabolism (for example fluorodeoxyglucose-6-phosphate/FDG-6-P), to estimate rates of glucose uptake and metabolism. 31P MRS (depicted in blue) provides information about ATP production and thus brain energy metabolism. 13C-MRS (depicted in green) is useful for estimating TCA cycle fluxes and CMRglc, derived from 13C label incorporation into specific metabolites (Glu, Gln). Both ASL and BOLD fMRI provide estimates of CBF

