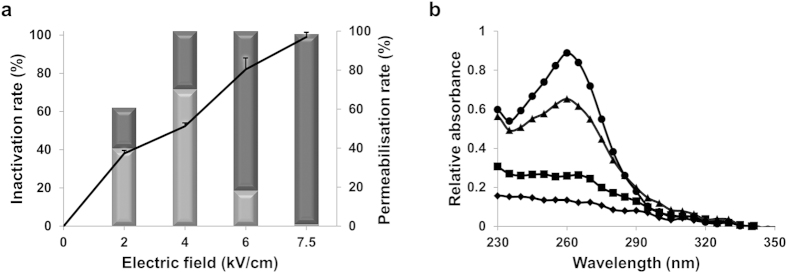
Figure 1. Cell membrane permeabilisation induced inactivation of vegetative bacteria.
(a) Effect of 1000 pulses at different electric field strengths on inactivation of the vegetative form (black curve) and the percentage of plasma membrane permeabilisations (light diagram for reversible and dark diagram for irreversible). (b) Nucleic acids released according to electric field wavelength length applied. Absorbance spectra of the supernatant solution of vegetative bacteria having received 1000 pulses at 2kV/cm, diamonds; 4 kV/cm, squares; 6 kV/cm, triangles; 7.5 kV/cm, circles. The absorbance values were obtained after subtraction of supernatant values of untreated bacteria. All experiments were performed in triplicate.

