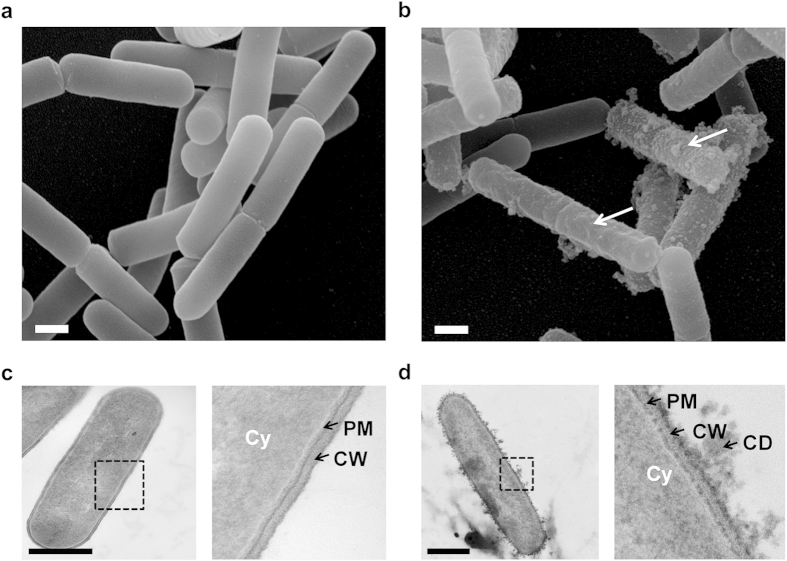
Figure 2. PEF-induced cell wall disruption on vegetative bacteria.
(a) SEM image showing population of untreated bacteria. Bacteria are smooth. (b) Pulsed bacteria were visualized by SEM after PEF exposure (1000 micropulses at 7.5 kV/cm). White arrows indicate surface damage. (c) TEM image of untreated Bacillus pumilus. Inset shows bacterial architecture with the cytoplasm (Cy), plasma membrane (PM) and cell wall (CW). (d) TEM image of a pulsed bacterium after PEF. Inset shows the expulsion of cell-debris (CD), damage to the PM and the CW. Scale bars: 500 nm.

