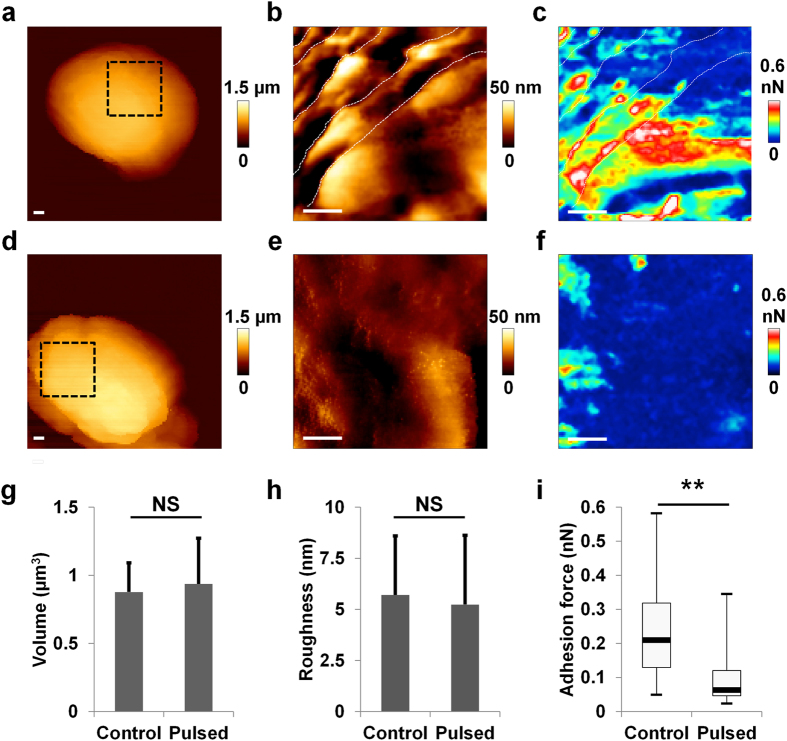
Figure 5. PEF decreased the hydrophobicity of spores.
(a,d) Example of AFM image of spores; inset shows localization of height resolution image (b,e) and adhesion force map (c,f); from an untreated spore (a–c) and pulsed spore (d–f) with 10 000 micropulses at 7.5 kV/cm. Scale bars: 100 nm. (g) Statistical analysis of spore volume. There is no variation after PEF exposure. The measurements were performed on four replicates per condition on at least 25 spores. (h) Statistical analysis of roughness. The roughness is similar between untreated and pulsed spores. The diagram was obtained with 25 spores per condition, from four independent experiments. (i) Statistical analysis of hydrophobicity. A decrease of hydrophobicity was measured after PEF. For each condition, box plots were drawn from adhesion maps of 16 384 curves from seven spores in two independent experiments.

