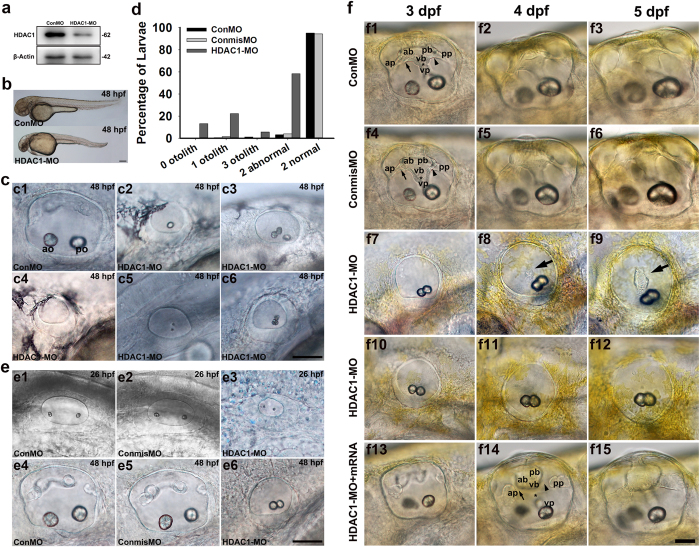
Figure 3. Phenotypes of HDAC1 knockdown by antisense morpholino oligonucleotides.
(a) The HDAC1 protein level in HDAC1-MO-injected embryos was significantly lower than control embryos at 24 hpf. (b) Gross phenotypic morphology of control and HDAC1 morphant embryos. The HDAC1 morphant at 48 hpf shows morphological abnormalities and abnormal otic vesicles. (c) Morphological development of the inner ear requires HDAC1. (c1) Control larvae (48 hpf) have two normal otoliths. The positions of the anterior otolith (ao) and posterior otolith (po) are indicated. Based on the otolith phenotypes, zebrafish HDAC1 morphants were classified into the following five categories: (c2) the one otolith group; (c3) the multiple otolith group; (c4) the absent otolith group; (c5) the two abnormal otolith group; and (c6) the two normal otolith group. (d) Percentages of embryos in each category (n = 321 for ConMO n = 157 for ConmisMO, and n = 211 for HDAC1 morphants). (e) The overall morphology of otic vesicles in control embryos (ConMO and ConmisMO) and HDAC1 morphants at 26 hpf (e1–e3) and 48 hpf (e4–e6). (f) Zebrafish semicircular canal phenotypes in controls (ConMO and ConmisMO), HDAC1 morphants, and HDAC1-MO + HDAC1mRNA co-injected embryos at 3 dpf, 4 dpf, and 5 dpf. Arrows show the junction of the anterior protrusion (ap) and the anterior bulge (ab). Arrowheads show the junction of the posterior bulge (pb) and posterior protrusion (pp). Asterisks show the junction between the ventral bulge (vb) and ventral protrusion (vp). Arrows in f8 and f9 mark ventral projections. The arrow, arrowhead, and asterisk in f14 mark unfused projections. All images are lateral views with the anterior to the left and the dorsal side up. Scale bars are 200 μm (b) and 50 μm (c,e,f).

